> ## Documentation Index
> Fetch the complete documentation index at: https://docs.usefluency.com/llms.txt
> Use this file to discover all available pages before exploring further.
# Applications
> Browse every application Fluency has observed in your organization, with real usage counts, and use them as an index into the work that runs through each one.
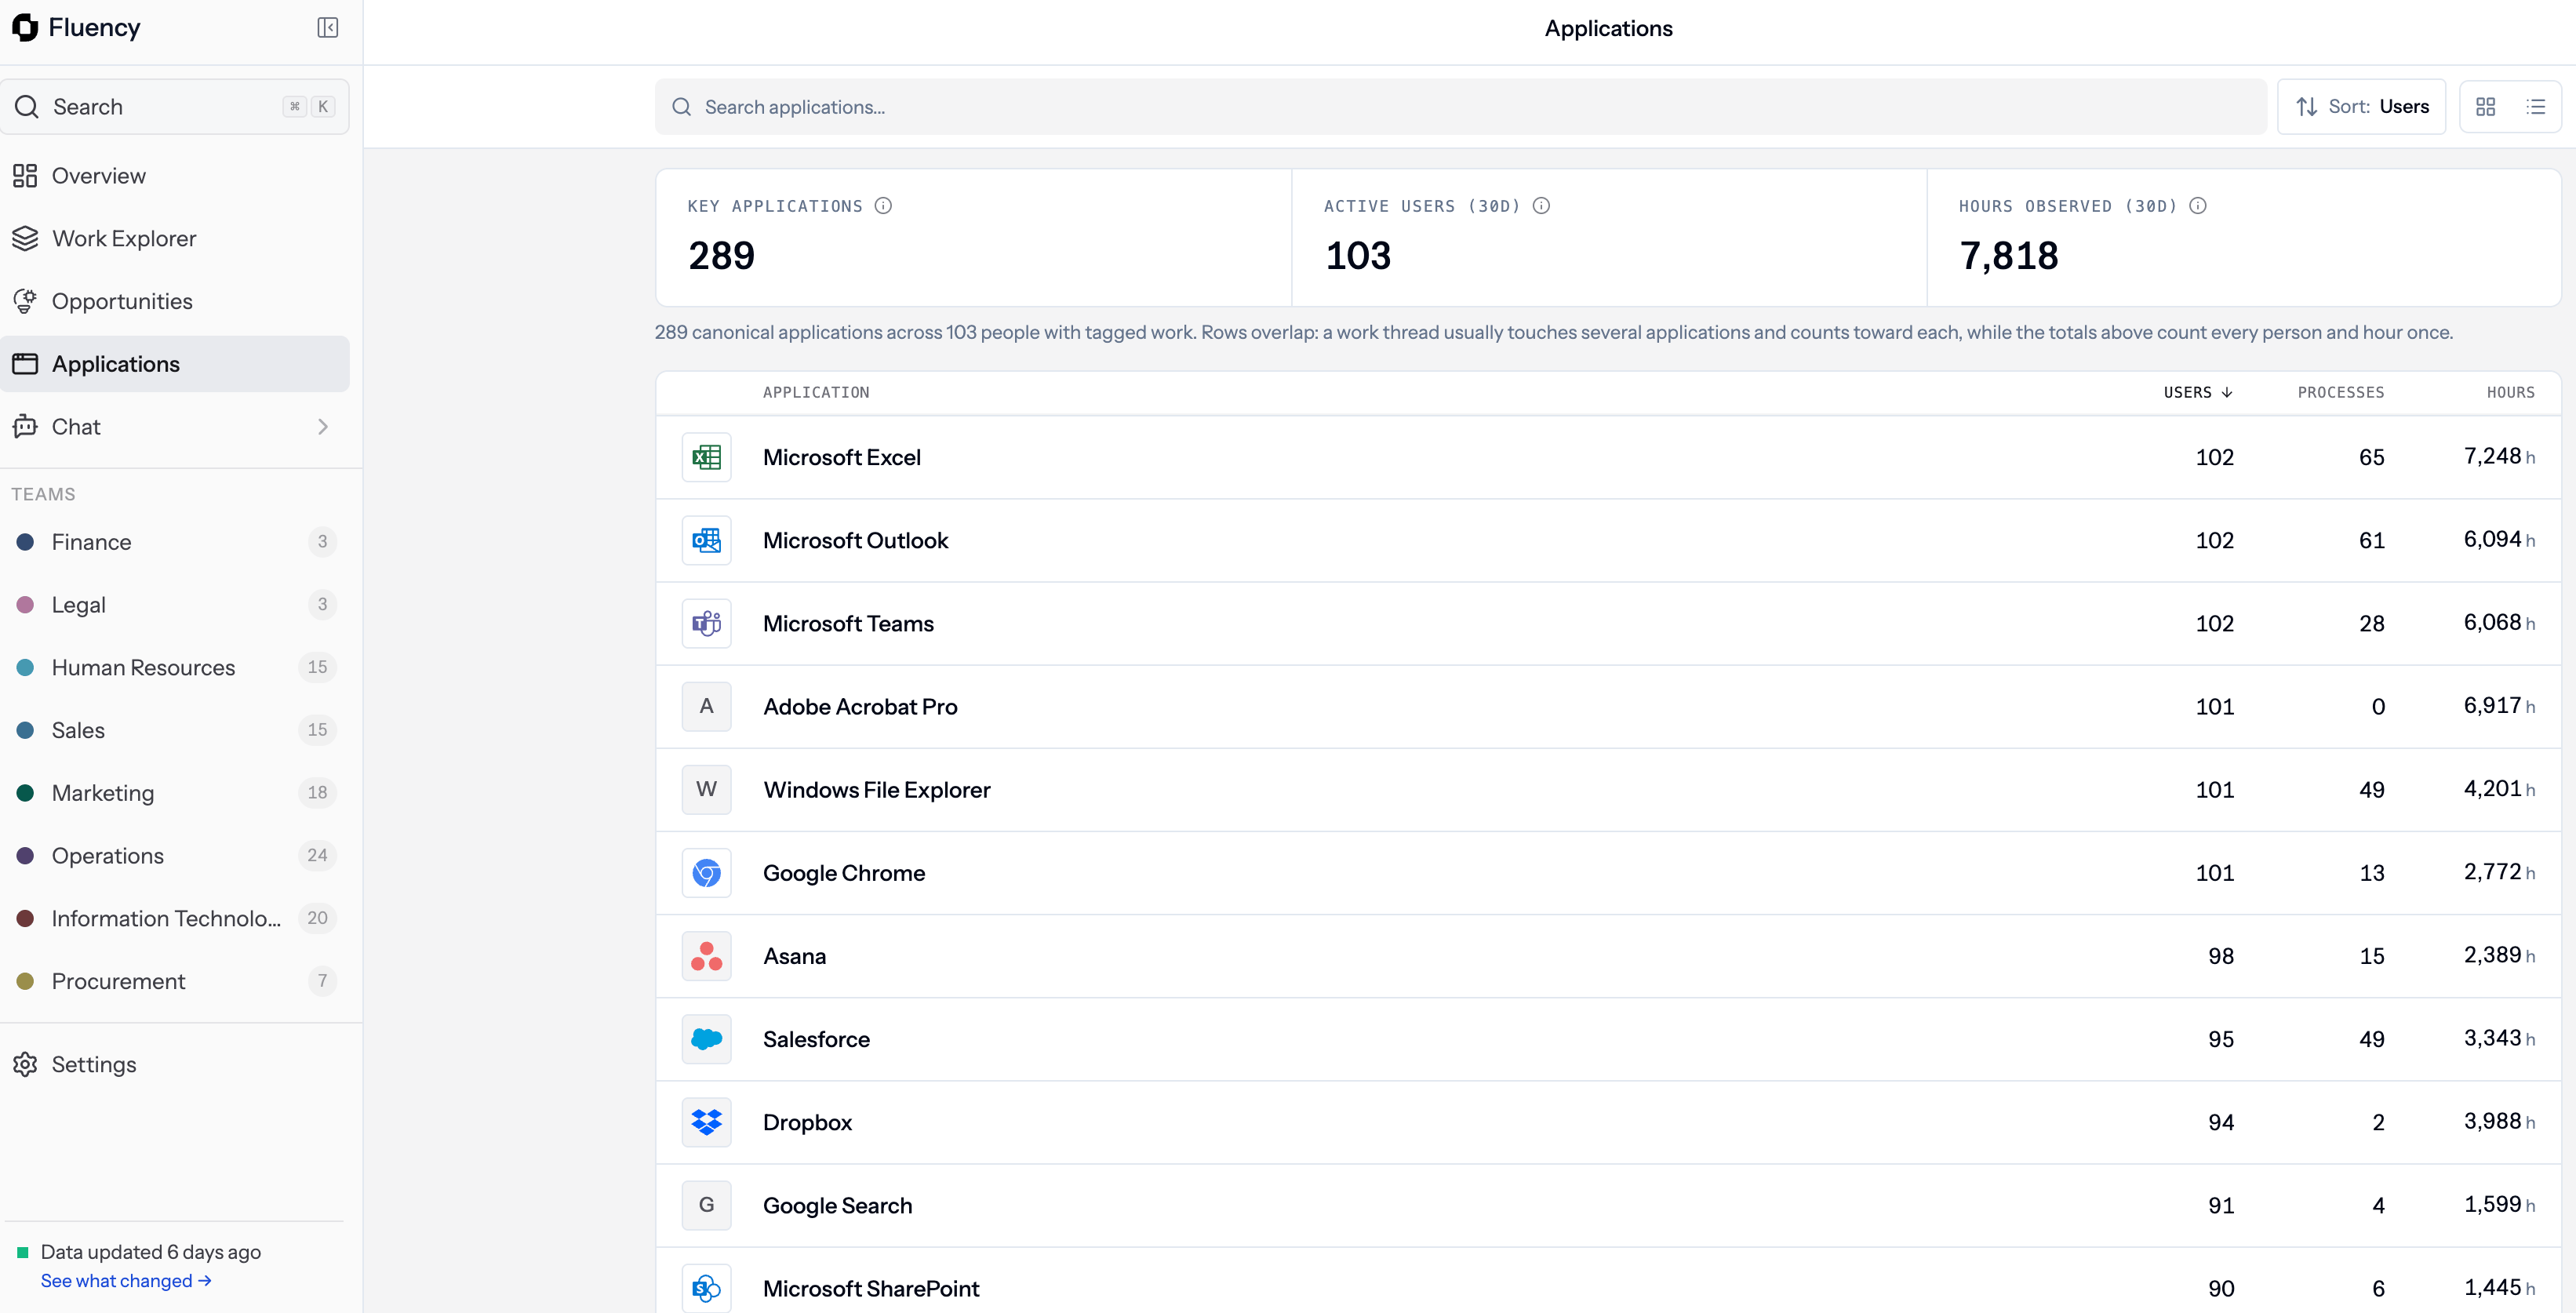
**Applications** is your live inventory of every tool people actually use to get work done, built automatically from what the Fluency Desktop Agent observes. Every application is enriched with real usage (users, processes, hours), so you can see which tools your organization runs on and use any application as an index into the work that runs through it.
Open [app.usefluency.com](https://app.usefluency.com) → **Applications**.
 ## How the inventory gets built
You don't need to import a software list. Fluency builds it for you: the Desktop Agent captures activity per your [Agent Policy](/configuring-agent-settings), resolves window titles, executables, and browser tabs into a single canonical app (for example, all Salesforce Lightning tabs roll up into **Salesforce**), and tags every observed step with the app it happened in.
An application only appears once Fluency has tagged real observed work in it. Useful coverage typically kicks in after about a week and gets richer over time.
## Key figures
Three headline numbers summarize your application footprint over the last 30 days.
| Metric | What it shows |
| ------------------------ | ---------------------------------------------------------------- |
| **Key applications** | Canonical applications Fluency has tagged in observed work. |
| **Active users (30D)** | Distinct people who used any tagged application. |
| **Hours observed (30D)** | Total time the Agent observed across all users and applications. |
Rows in the table below overlap, because a single work thread usually touches several applications. The totals above count every person and every hour only once.
## The application list
Every application appears as a row, sorted by **Users** by default.
| Column | What it shows |
| --------------- | --------------------------------------------------------------------------------- |
| **Application** | The canonical name and icon of the app. |
| **Users** | Distinct people who used the app in the last 30 days. |
| **Processes** | How many discovered [processes](/understanding-work-explorer) the app appears in. |
| **Hours** | Total observed hours in the app in the last 30 days. |
Use **Sort** to order by Users, Processes, or Hours, and the search bar to jump to a specific application.
## The application page
Click any application to open its detail page: where it goes from *"this tool is in use"* to *"here is exactly what work runs through it"*.
## How the inventory gets built
You don't need to import a software list. Fluency builds it for you: the Desktop Agent captures activity per your [Agent Policy](/configuring-agent-settings), resolves window titles, executables, and browser tabs into a single canonical app (for example, all Salesforce Lightning tabs roll up into **Salesforce**), and tags every observed step with the app it happened in.
An application only appears once Fluency has tagged real observed work in it. Useful coverage typically kicks in after about a week and gets richer over time.
## Key figures
Three headline numbers summarize your application footprint over the last 30 days.
| Metric | What it shows |
| ------------------------ | ---------------------------------------------------------------- |
| **Key applications** | Canonical applications Fluency has tagged in observed work. |
| **Active users (30D)** | Distinct people who used any tagged application. |
| **Hours observed (30D)** | Total time the Agent observed across all users and applications. |
Rows in the table below overlap, because a single work thread usually touches several applications. The totals above count every person and every hour only once.
## The application list
Every application appears as a row, sorted by **Users** by default.
| Column | What it shows |
| --------------- | --------------------------------------------------------------------------------- |
| **Application** | The canonical name and icon of the app. |
| **Users** | Distinct people who used the app in the last 30 days. |
| **Processes** | How many discovered [processes](/understanding-work-explorer) the app appears in. |
| **Hours** | Total observed hours in the app in the last 30 days. |
Use **Sort** to order by Users, Processes, or Hours, and the search bar to jump to a specific application.
## The application page
Click any application to open its detail page: where it goes from *"this tool is in use"* to *"here is exactly what work runs through it"*.
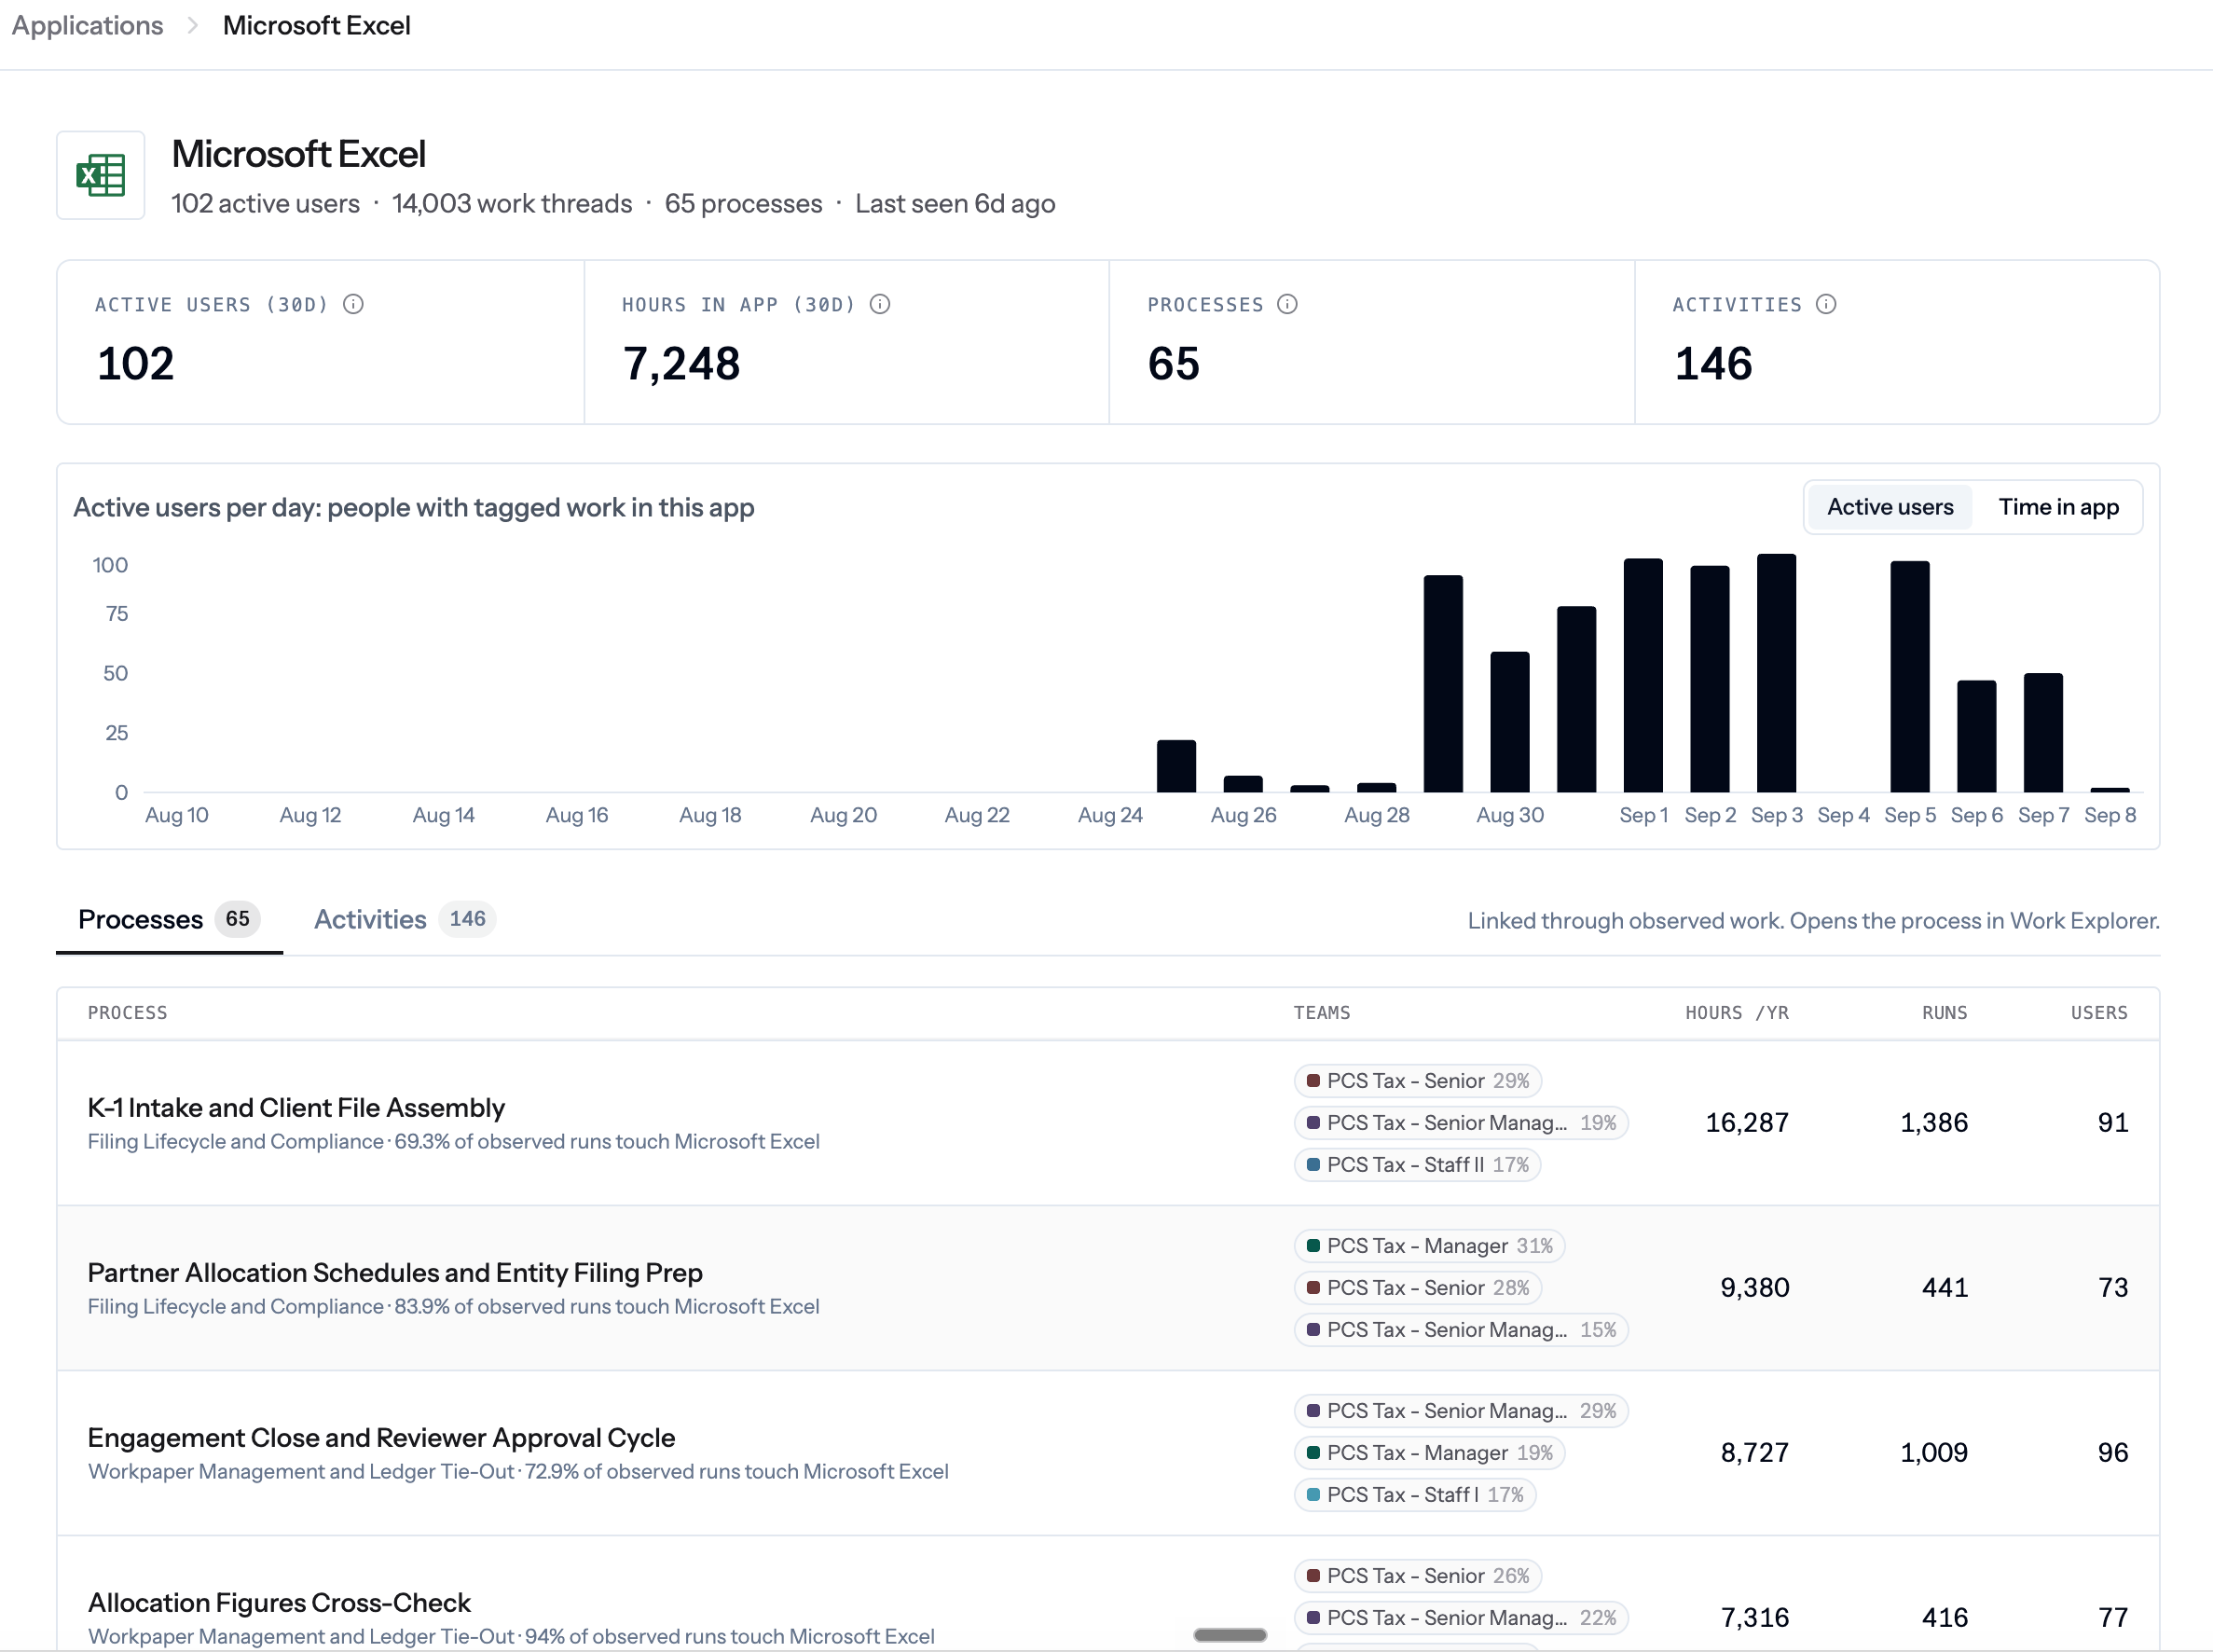 Four headline numbers show how the app is used across the organization:
* **Active users (30D)** and **Hours in app (30D)** for adoption and time spent.
* **Processes** and **Activities** for the pieces of work it appears in.
Below that, a chart plots **Active users** or **Time in app** per day (toggle in the top right), so you can spot adoption trends, drop-offs after a rollout, or usage spikes.
The **Processes** and **Activities** tabs list every piece of work the app is part of, with team breakdown, annual hours, runs per year, and users involved. Click any row to open it in [Work Explorer](/understanding-work-explorer) and see the full diagram, steps, and runs behind the numbers.
## Common ways to use this page
Sort by **Hours** to see where the organization spends the most time. These are the systems worth understanding, integrating with, or automating first.
Scan for apps you didn't know were in use. Anything with meaningful **Users** or **Hours** is worth reviewing with IT and procurement.
Compare **Users** here against license counts to find over- or under-provisioned tools.
Sort by **Processes** to find apps that appear across many workflows. Those are the highest-leverage automation targets.
## Why it matters
* One source of truth for your real software footprint, based on observation instead of a static asset list.
* A shortcut into [Work Explorer](/understanding-work-explorer): pick an application, see every process that runs through it.
* Grounded input for rationalization, licensing, and automation decisions, tied back to steps and executions you can open and inspect.
## Related
See how observed applications connect into end-to-end processes.
Turn application and process signals into automation candidates.
Control when and where the Agent observes application activity.
Review how sensitive data is handled in captured application content.
Four headline numbers show how the app is used across the organization:
* **Active users (30D)** and **Hours in app (30D)** for adoption and time spent.
* **Processes** and **Activities** for the pieces of work it appears in.
Below that, a chart plots **Active users** or **Time in app** per day (toggle in the top right), so you can spot adoption trends, drop-offs after a rollout, or usage spikes.
The **Processes** and **Activities** tabs list every piece of work the app is part of, with team breakdown, annual hours, runs per year, and users involved. Click any row to open it in [Work Explorer](/understanding-work-explorer) and see the full diagram, steps, and runs behind the numbers.
## Common ways to use this page
Sort by **Hours** to see where the organization spends the most time. These are the systems worth understanding, integrating with, or automating first.
Scan for apps you didn't know were in use. Anything with meaningful **Users** or **Hours** is worth reviewing with IT and procurement.
Compare **Users** here against license counts to find over- or under-provisioned tools.
Sort by **Processes** to find apps that appear across many workflows. Those are the highest-leverage automation targets.
## Why it matters
* One source of truth for your real software footprint, based on observation instead of a static asset list.
* A shortcut into [Work Explorer](/understanding-work-explorer): pick an application, see every process that runs through it.
* Grounded input for rationalization, licensing, and automation decisions, tied back to steps and executions you can open and inspect.
## Related
See how observed applications connect into end-to-end processes.
Turn application and process signals into automation candidates.
Control when and where the Agent observes application activity.
Review how sensitive data is handled in captured application content.