> ## Documentation Index
> Fetch the complete documentation index at: https://docs.usefluency.com/llms.txt
> Use this file to discover all available pages before exploring further.
# Opportunities
> Turn observed work into a ranked backlog of AI automation opportunities you can act on.
**Opportunities** is your ranked backlog of AI automation opportunities, built automatically from what [Work Explorer](/understanding-work-explorer) sees. Every AI automation opportunity traces back to real observed work, so you can open any of them and inspect the steps, apps, and people behind the number.
Open [app.usefluency.com](https://app.usefluency.com) → **Opportunities**.
## How AI automation opportunities get created
You don't need to nominate candidates. Fluency does it for you.
The Desktop Agent captures activity and Work Explorer maps it into processes, activities, and steps.
Fluency scores each candidate on value and feasibility, and only promotes the AI automation opportunities that clear the bar.
Analysis is incremental. If a procedure hasn't changed, its AI automation opportunity is carried forward with a last-analyzed timestamp in the footer.
Want the full scoring model behind value, feasibility, quadrants, and gates? Reach out to [support@usefluency.com](mailto:support@usefluency.com) and we'll walk you through it.
## The Opportunities list
The page opens with a **Value × Feasibility** matrix, and the same AI automation opportunities as cards or rows underneath.
### Key figures
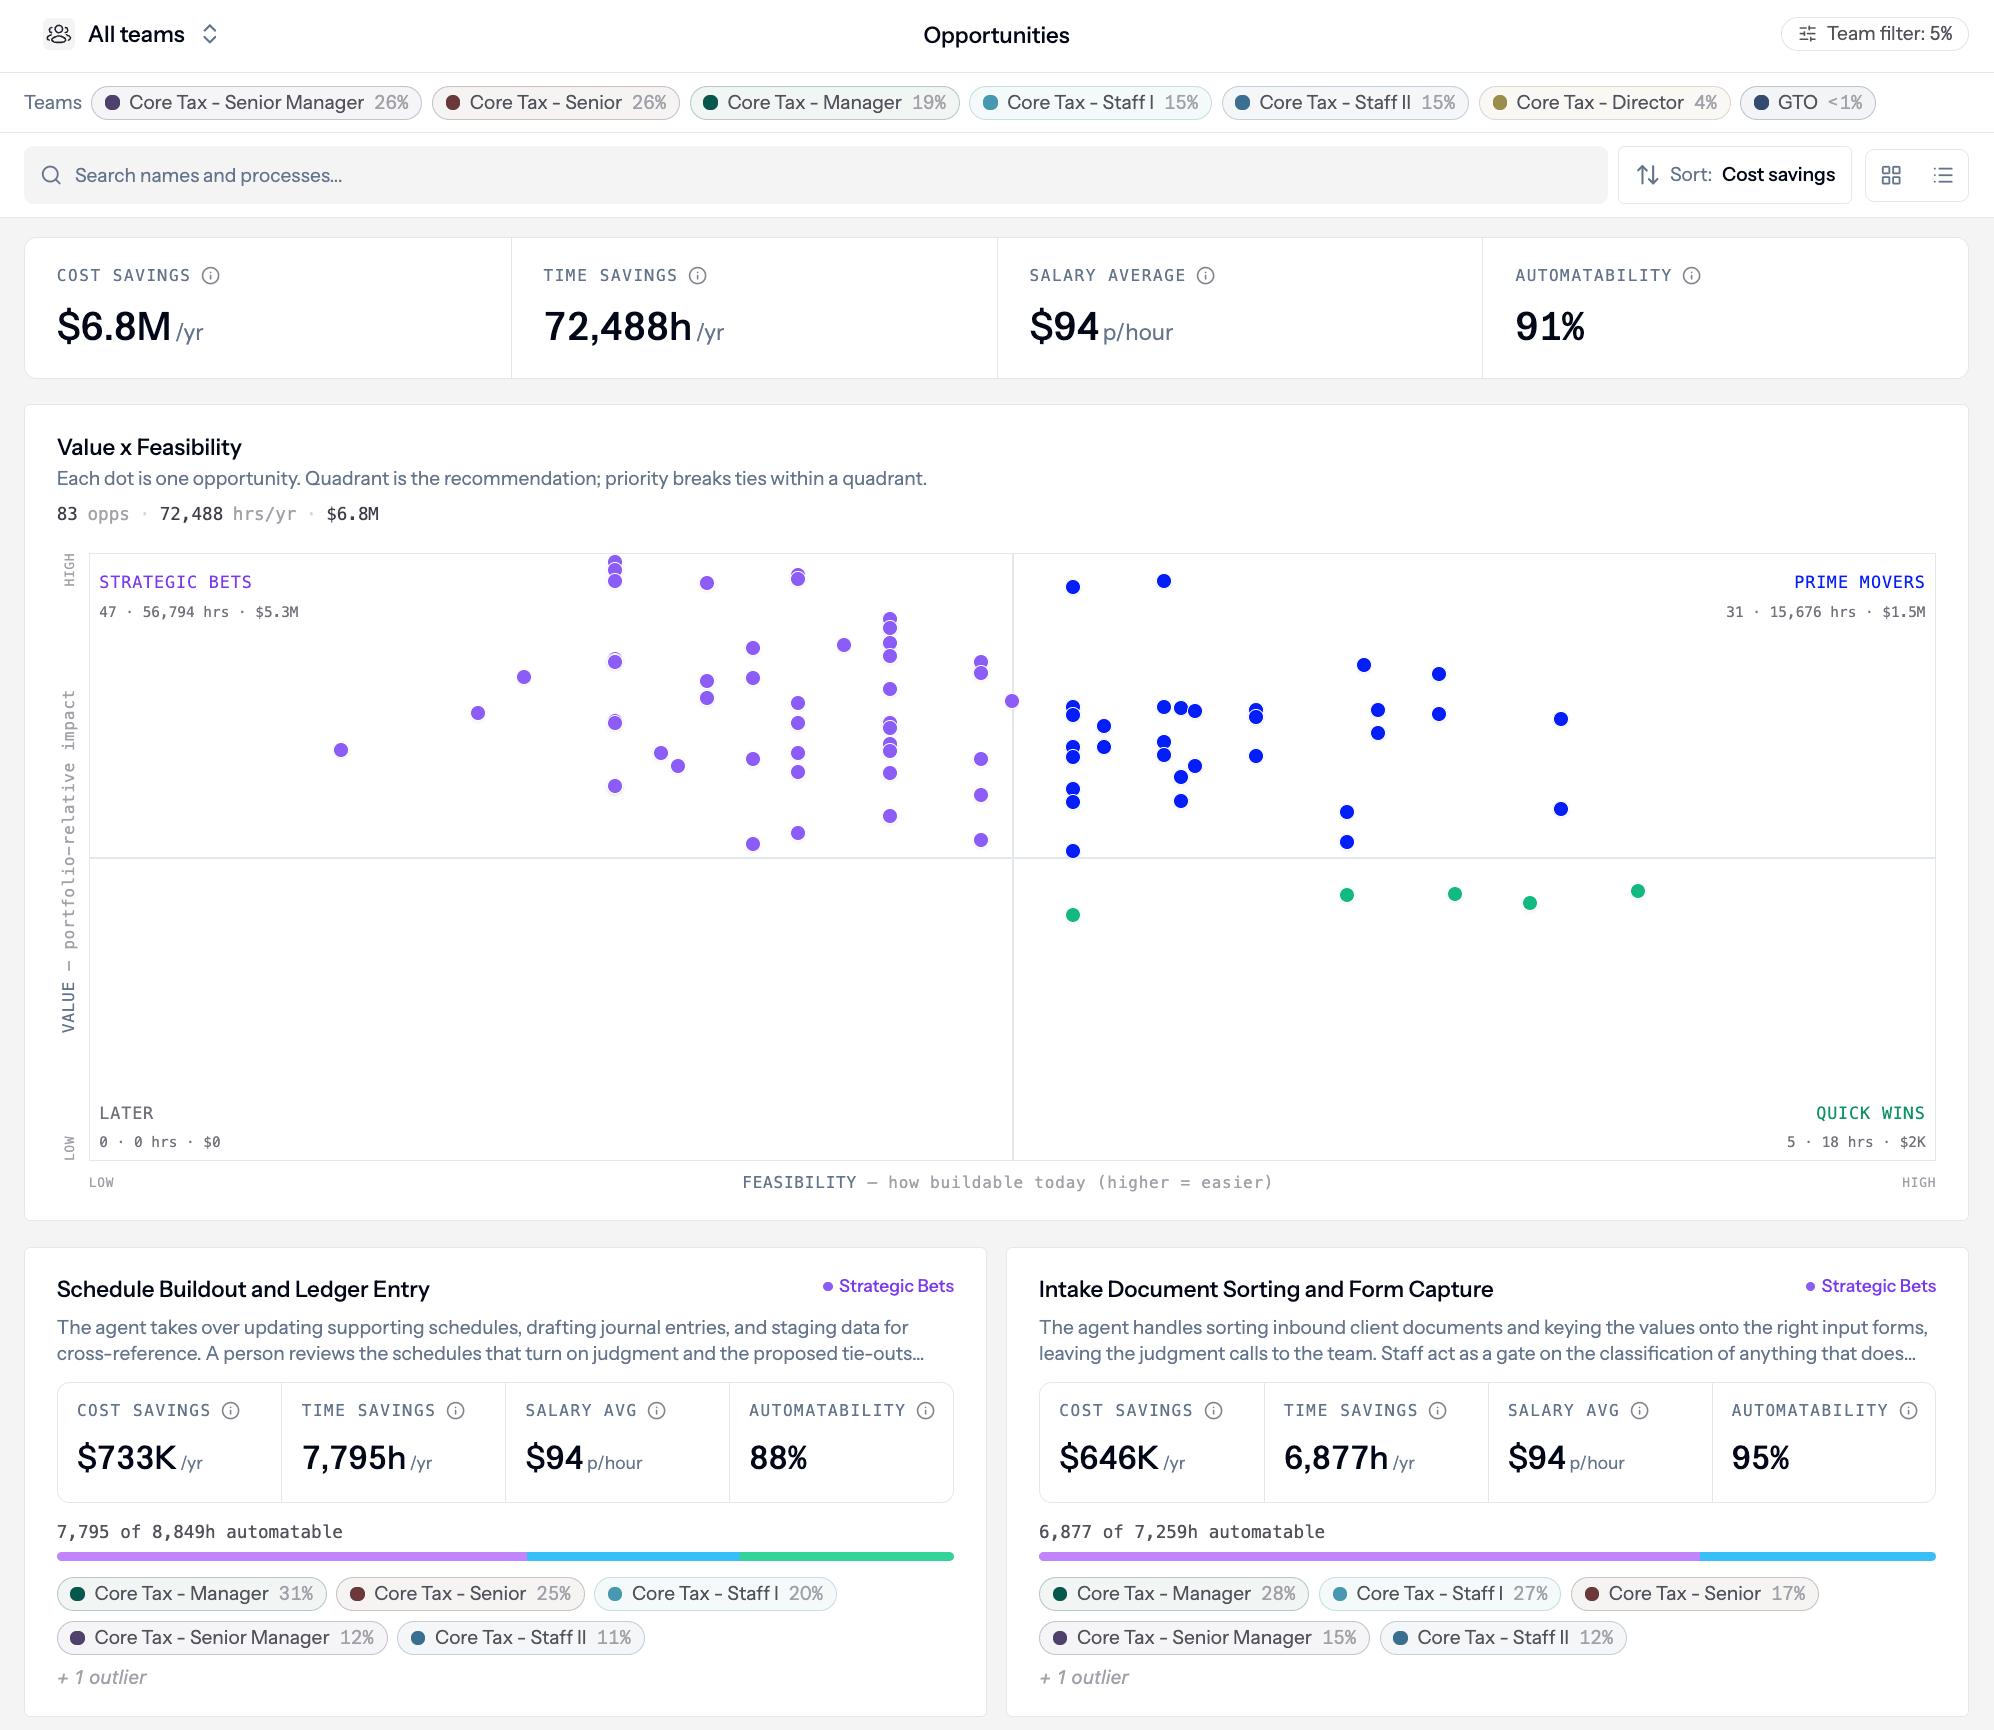 Four organization-level numbers summarize the backlog.
| Metric | What it shows |
| ------------------ | ------------------------------------------------------------------------------------------------------------------------------ |
| **Cost savings** | Estimated annual dollar impact if the visible AI automation opportunities shipped, priced using your [Rates](/settings-rates). |
| **Time savings** | Estimated annual hours recovered. |
| **Salary average** | Loaded hourly rate currently used to price labor (organization default, unless a team override applies). |
| **Automatability** | Share of judged steps Fluency treats as automatable across the backlog. |
### Value × Feasibility matrix
Four organization-level numbers summarize the backlog.
| Metric | What it shows |
| ------------------ | ------------------------------------------------------------------------------------------------------------------------------ |
| **Cost savings** | Estimated annual dollar impact if the visible AI automation opportunities shipped, priced using your [Rates](/settings-rates). |
| **Time savings** | Estimated annual hours recovered. |
| **Salary average** | Loaded hourly rate currently used to price labor (organization default, unless a team override applies). |
| **Automatability** | Share of judged steps Fluency treats as automatable across the backlog. |
### Value × Feasibility matrix
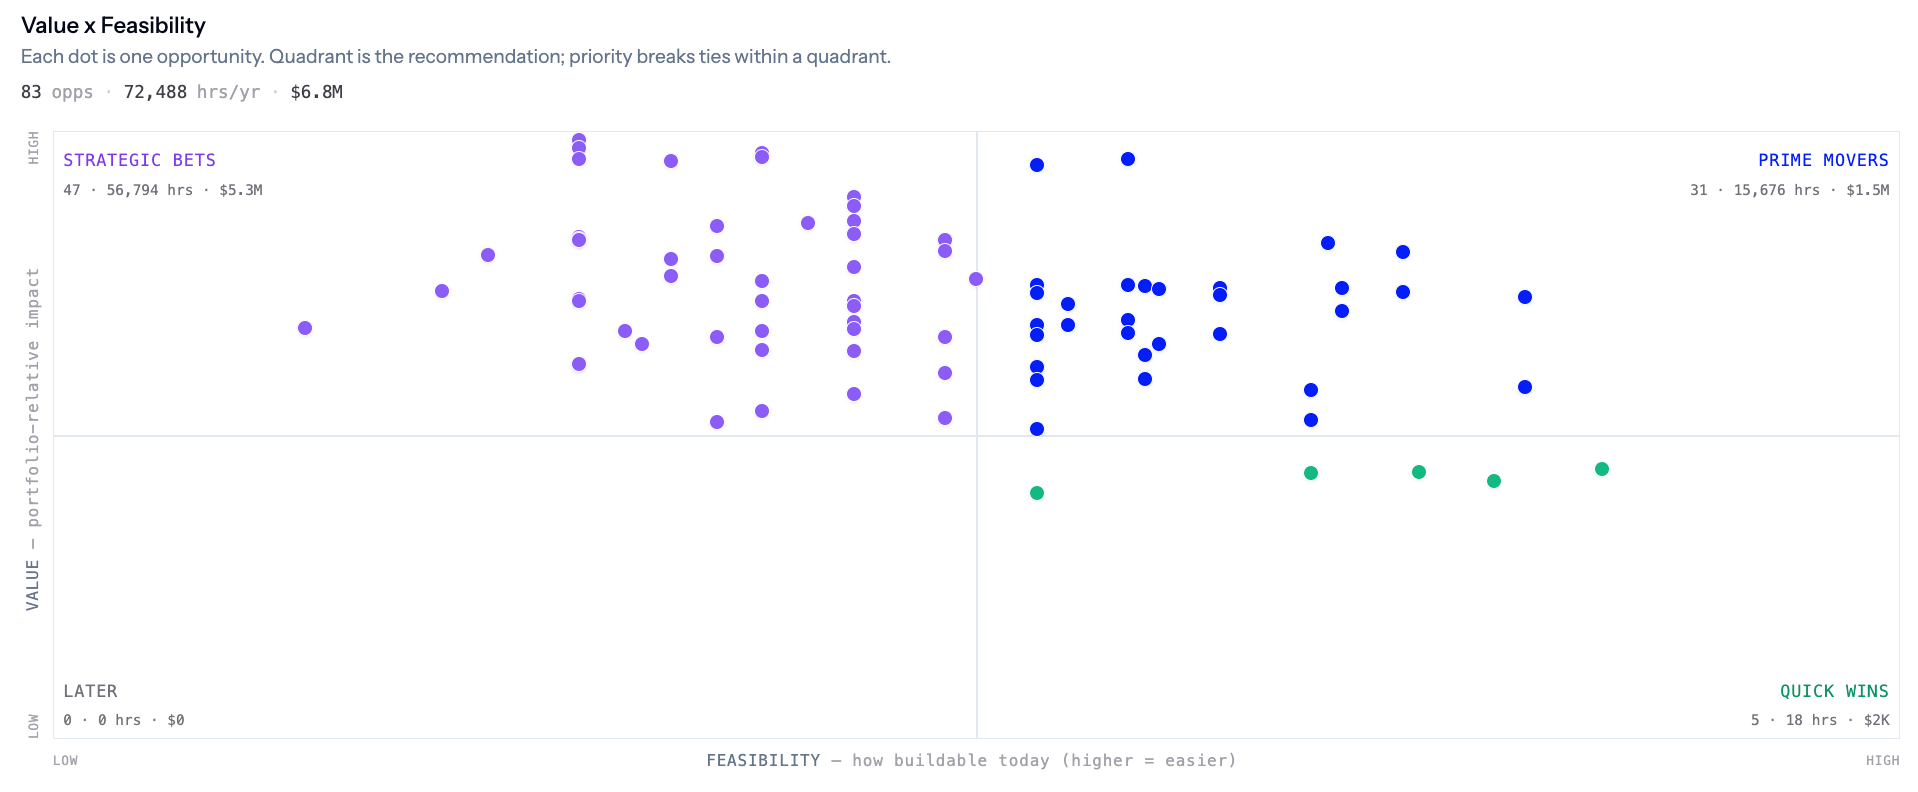 Each dot is one AI automation opportunity. **Value** is impact, **Feasibility** is how readily Fluency can deliver.
| Quadrant | What it means |
| ------------------ | ----------------------------------------------------------------------------------------- |
| **Quick Wins** | Lower value, high feasibility. Easy to ship and stack. |
| **Prime Movers** | High value, high feasibility. Default "do these first." |
| **Strategic Bets** | High value, lower feasibility. Worth the extra work (connectors, gates, phased delivery). |
| **Later** | Lower value, lower feasibility. Revisit when priorities shift. |
For a walkthrough of how each dot lands in a quadrant, contact [support@usefluency.com](mailto:support@usefluency.com).
### Cards vs rows
Toggle between **Cards** and **Rows**. You can sort (including by cost savings), filter by **team badges** (which shows the numbers aggregated by AI automation opportunities and specific steps touched only by that team), and search by name.
Rows show rank, quadrant, automatable percentage, annual impact, hours per year, feasibility score, and a **steps judged** bar showing how many steps have an assessment.
## Opening an AI automation opportunity
Click any AI automation opportunity to open its detail page. You can get there from the matrix or from the list below it.
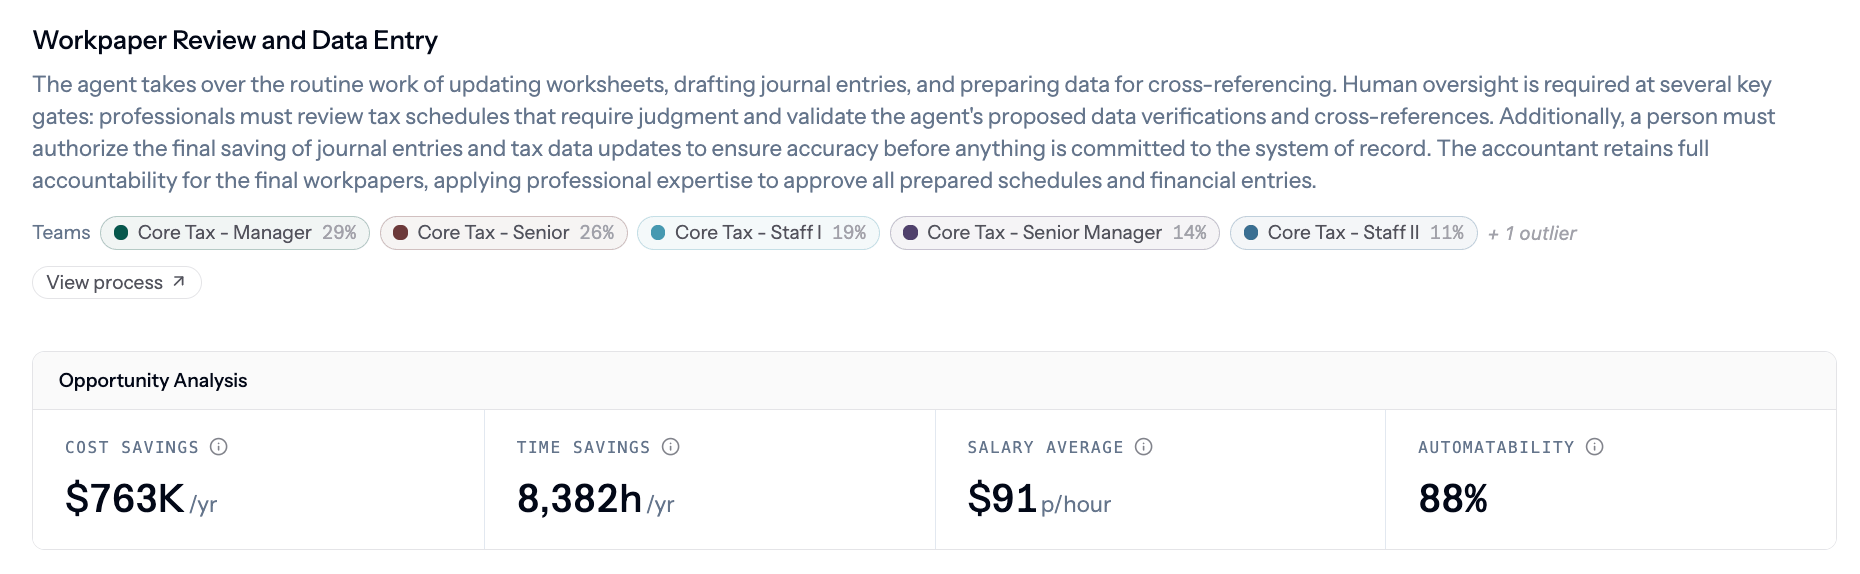
The header has a short narrative summary, team badges (with each team's share of the work), and a **View process** link back to Work Explorer.
### Opportunity analysis
Headline metrics for **this** AI automation opportunity: cost savings, time savings, salary average used in the model, and automatability.
Each dot is one AI automation opportunity. **Value** is impact, **Feasibility** is how readily Fluency can deliver.
| Quadrant | What it means |
| ------------------ | ----------------------------------------------------------------------------------------- |
| **Quick Wins** | Lower value, high feasibility. Easy to ship and stack. |
| **Prime Movers** | High value, high feasibility. Default "do these first." |
| **Strategic Bets** | High value, lower feasibility. Worth the extra work (connectors, gates, phased delivery). |
| **Later** | Lower value, lower feasibility. Revisit when priorities shift. |
For a walkthrough of how each dot lands in a quadrant, contact [support@usefluency.com](mailto:support@usefluency.com).
### Cards vs rows
Toggle between **Cards** and **Rows**. You can sort (including by cost savings), filter by **team badges** (which shows the numbers aggregated by AI automation opportunities and specific steps touched only by that team), and search by name.
Rows show rank, quadrant, automatable percentage, annual impact, hours per year, feasibility score, and a **steps judged** bar showing how many steps have an assessment.
## Opening an AI automation opportunity
Click any AI automation opportunity to open its detail page. You can get there from the matrix or from the list below it.
The header has a short narrative summary, team badges (with each team's share of the work), and a **View process** link back to Work Explorer.
### Opportunity analysis
Headline metrics for **this** AI automation opportunity: cost savings, time savings, salary average used in the model, and automatability.
 **Company-wide extrapolation** lets you edit **How many people do this work?** Fluency starts from the observed headcount and scales the projection. Changing the number doesn't rewrite observed executions, it only scales the estimat
 ### Activity workflow: Current, Changes, Proposed
Under **Activity workflow**, three tabs let you compare states. Each tab supports **Systems** or **Graph** view, plus **Show variants**.
### Activity workflow: Current, Changes, Proposed
Under **Activity workflow**, three tabs let you compare states. Each tab supports **Systems** or **Graph** view, plus **Show variants**.
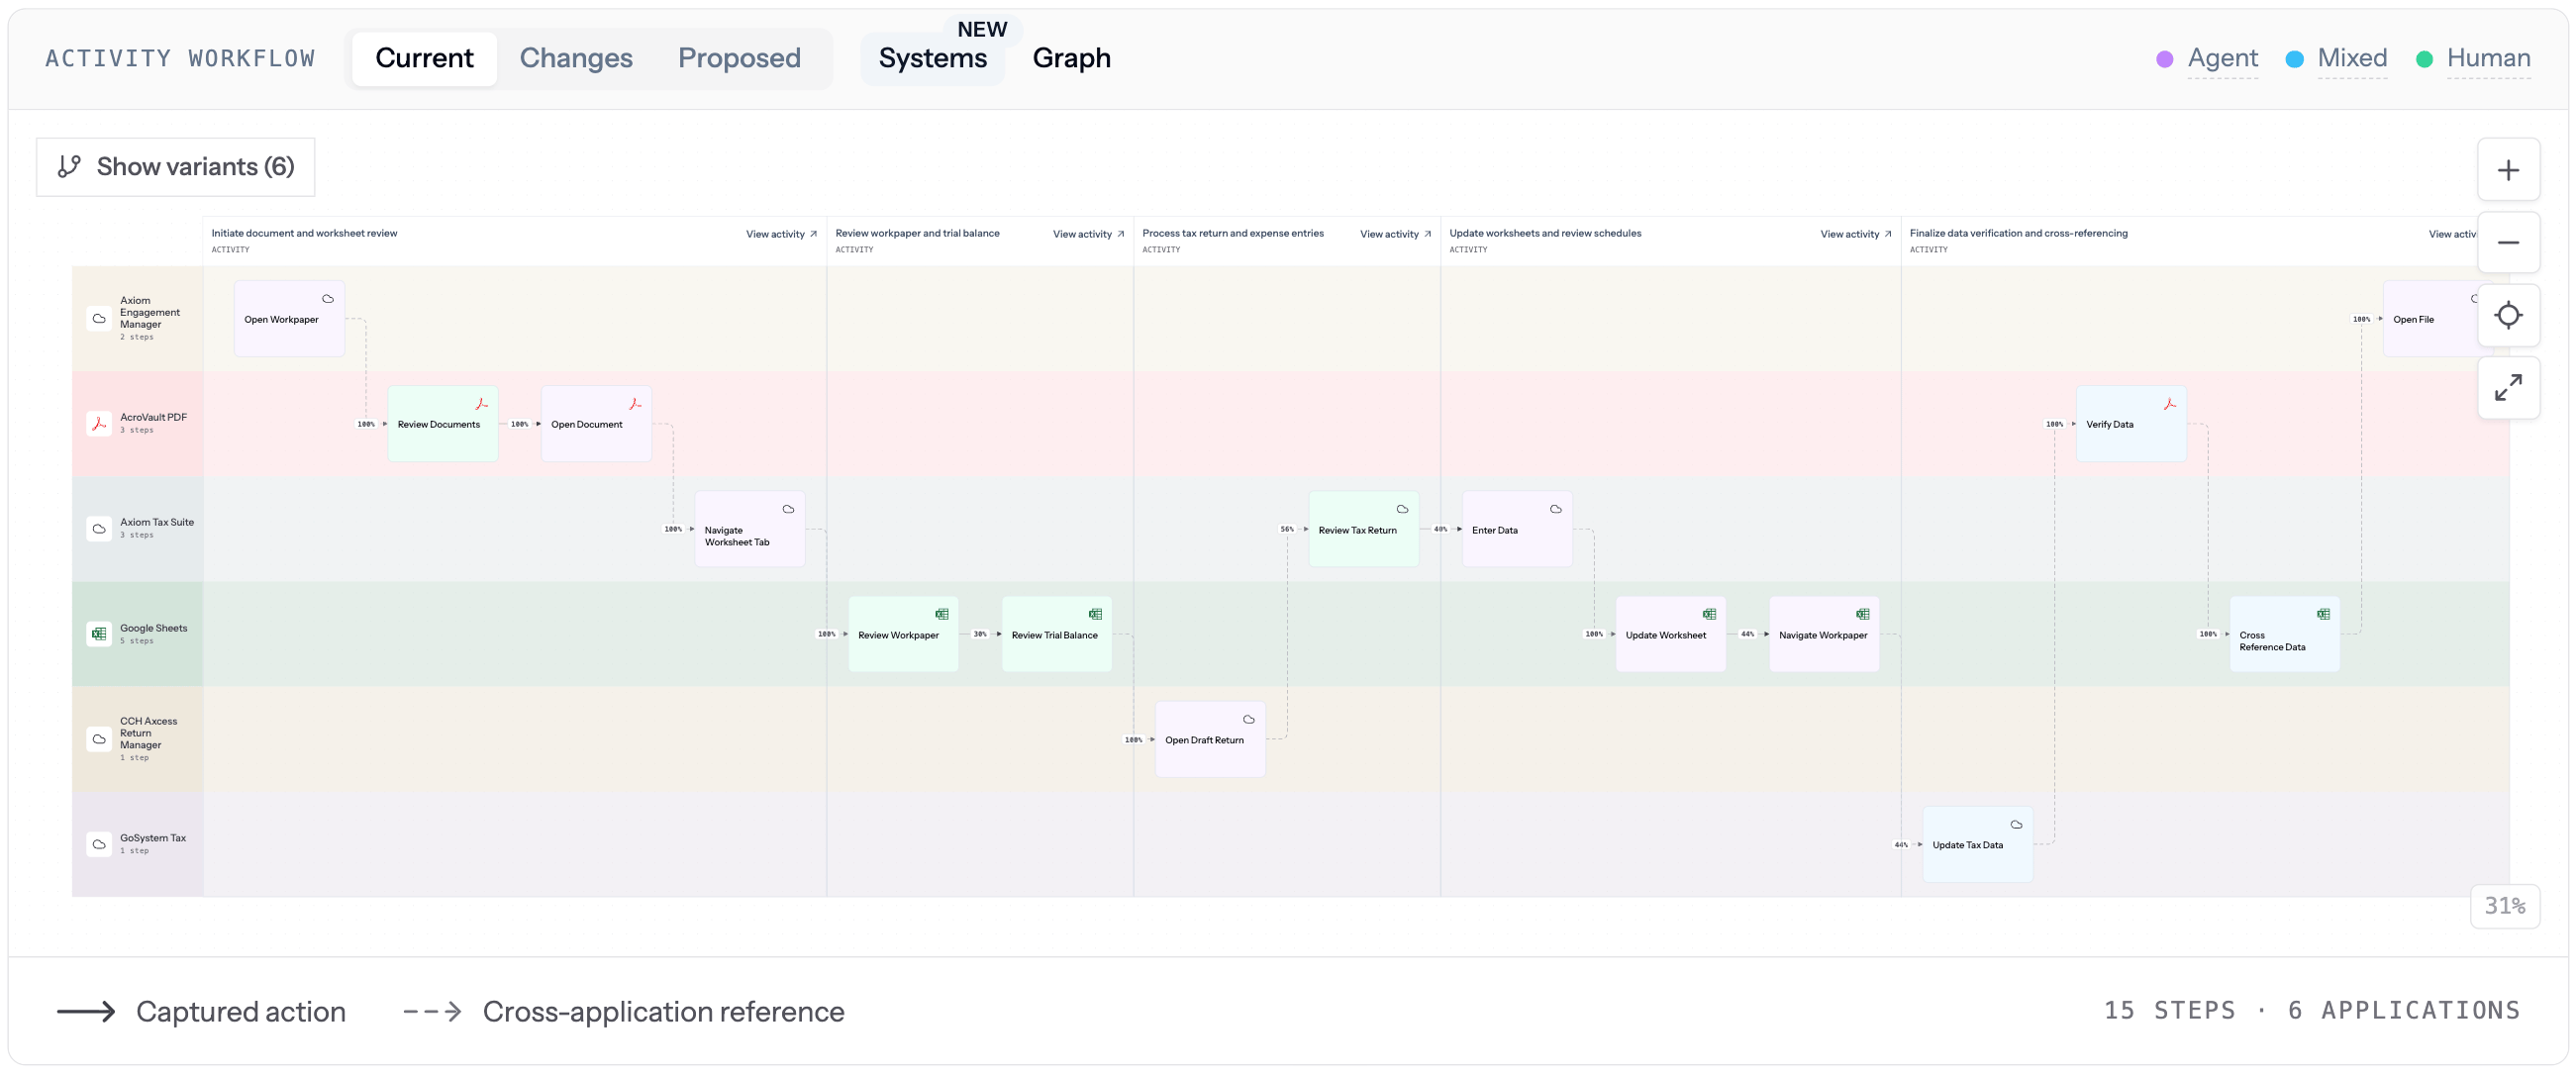 The workflow as it runs today, straight from Work Explorer.
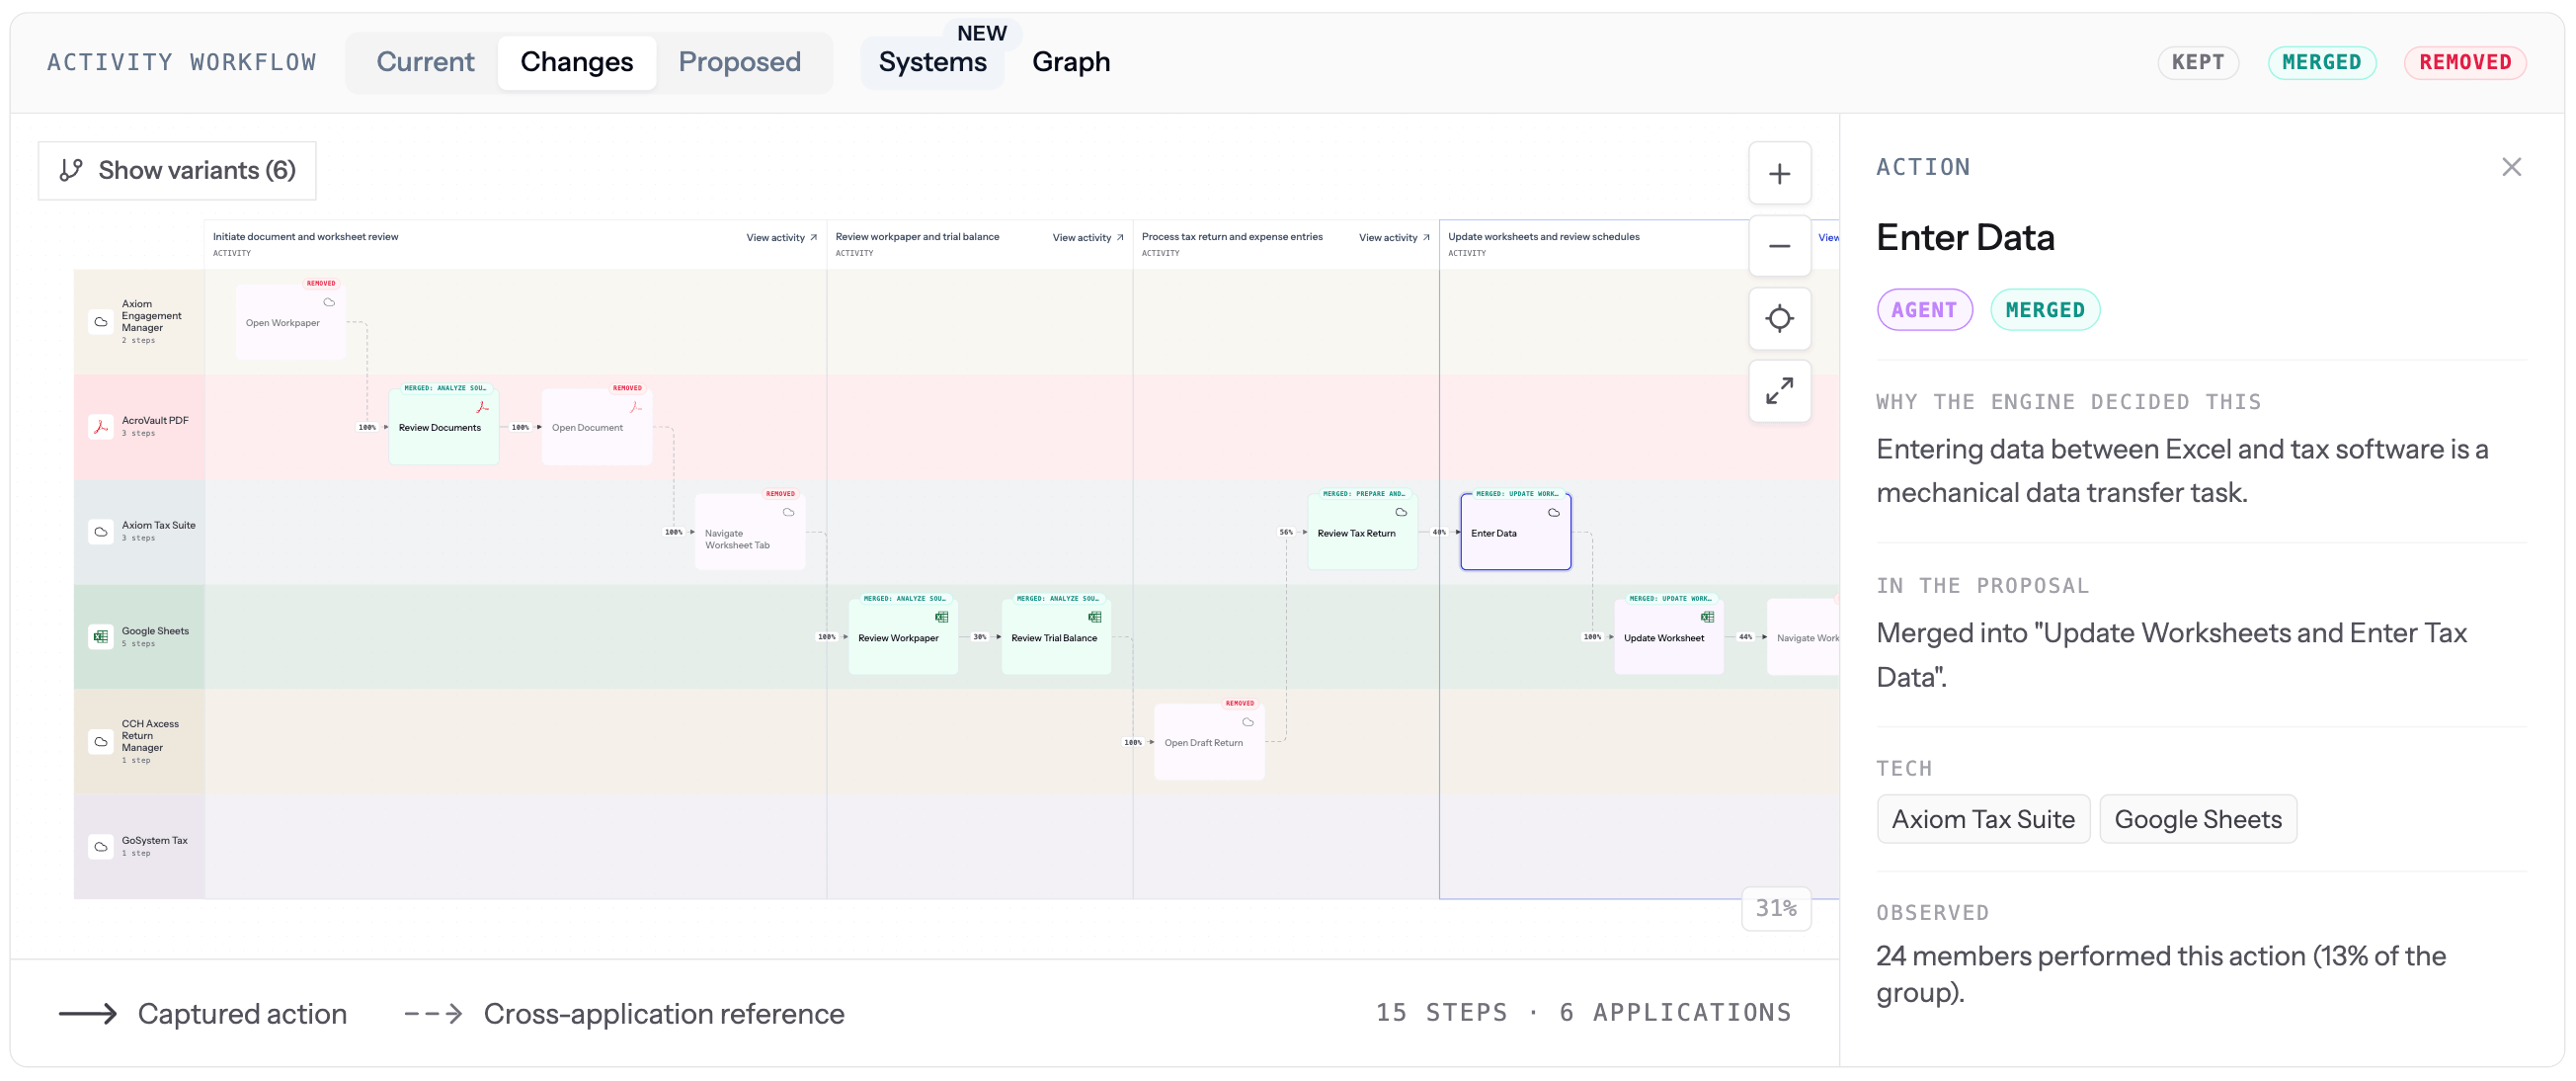 Current and proposed overlaid, with a **KEPT / MERGED / REMOVED** legend so you can see exactly what shifts.
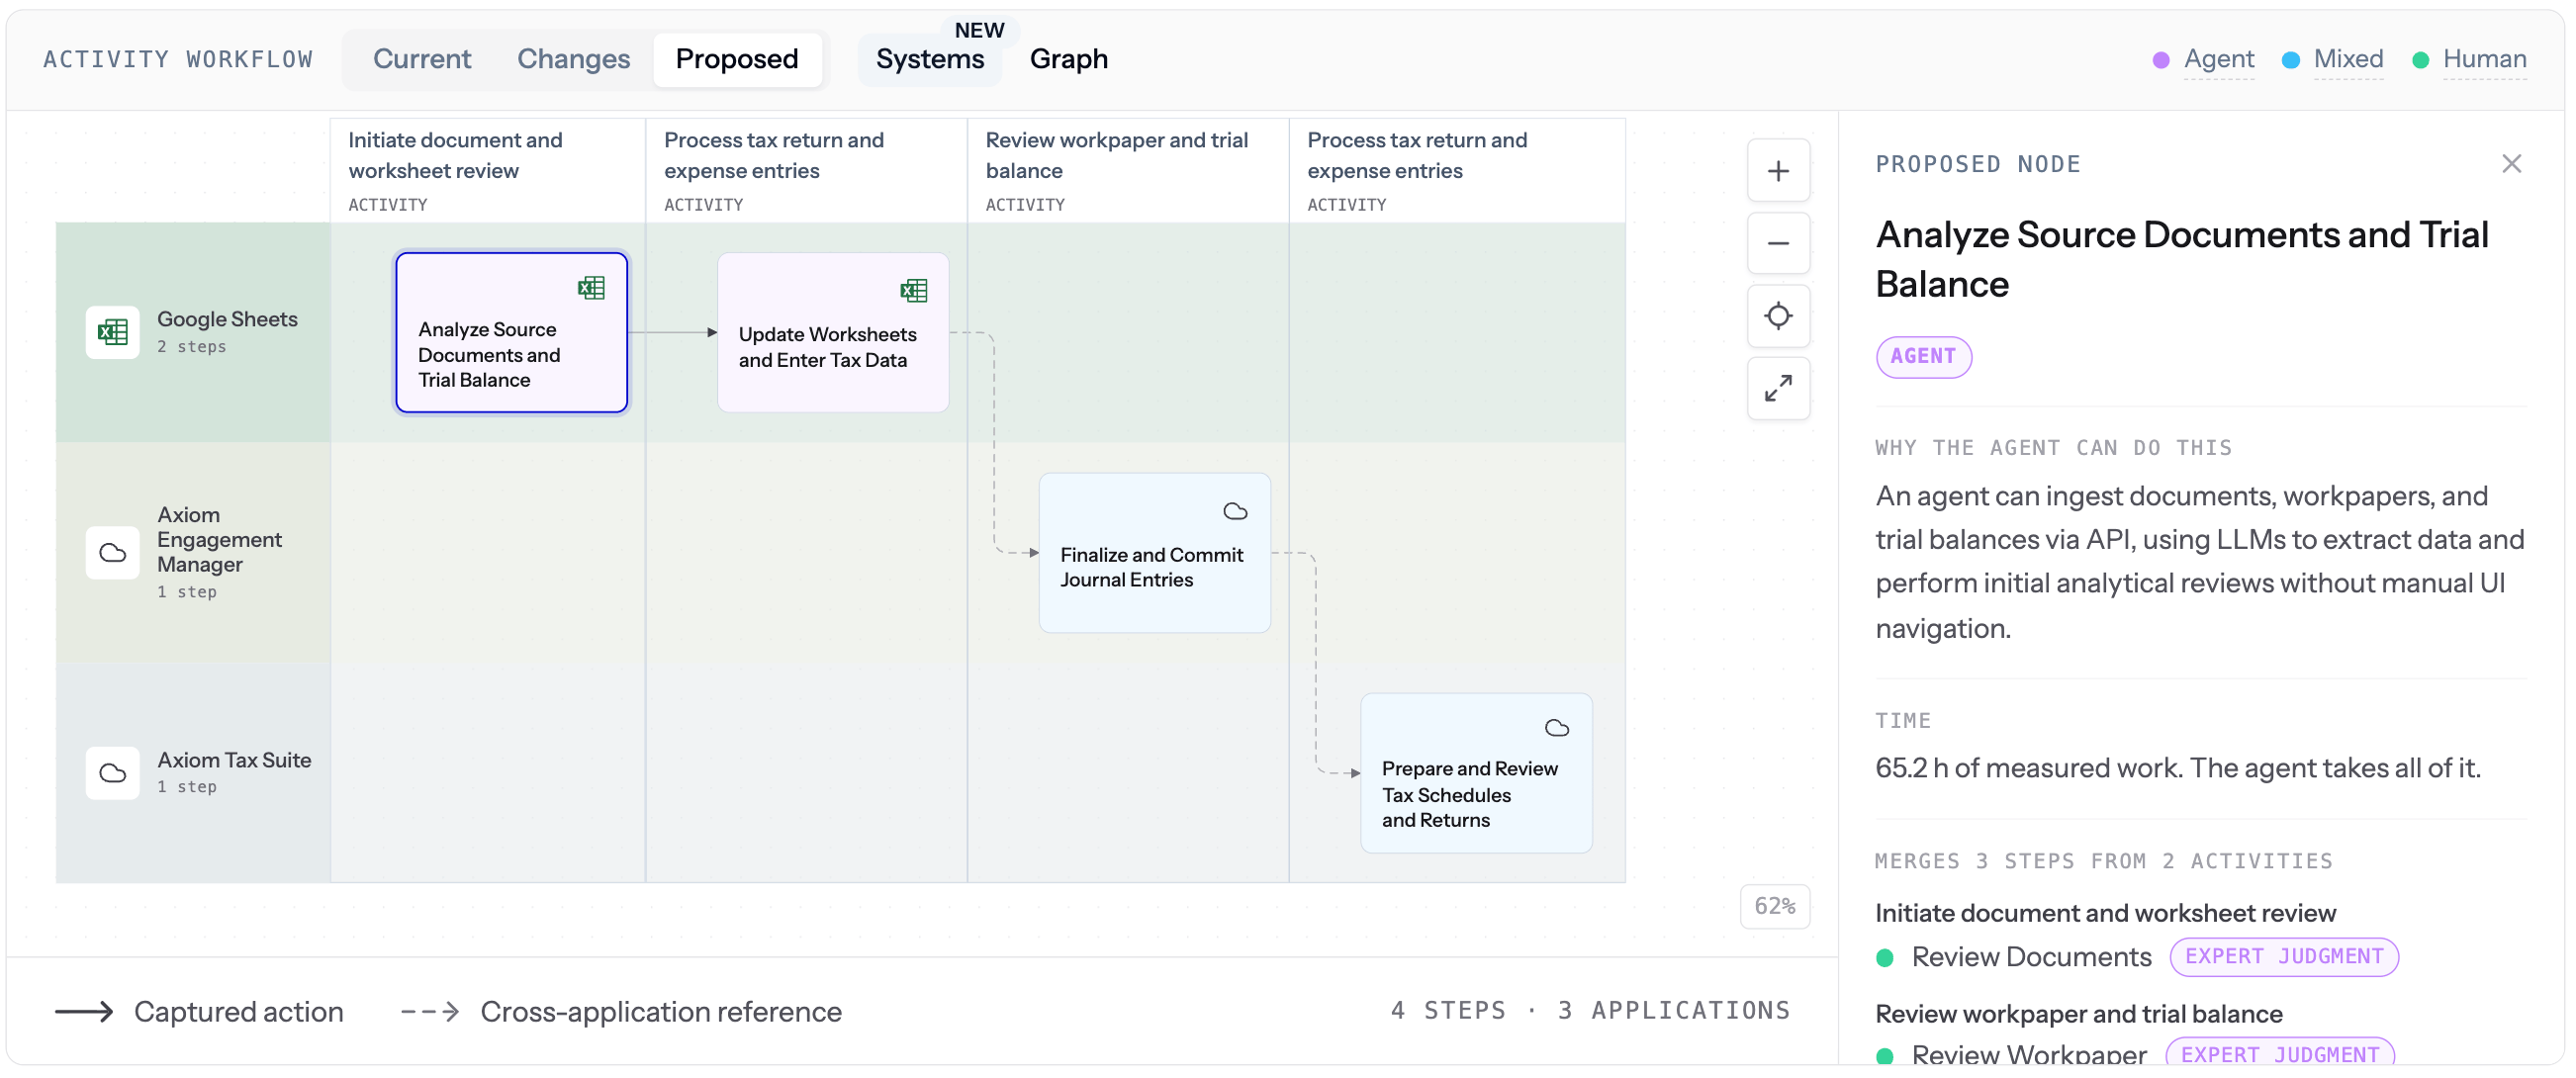 The workflow after the AI automation is in place. Essentially the current flow minus the delta of the changes.
### Step assessment and human checkpoints
The workflow after the AI automation is in place. Essentially the current flow minus the delta of the changes.
### Step assessment and human checkpoints
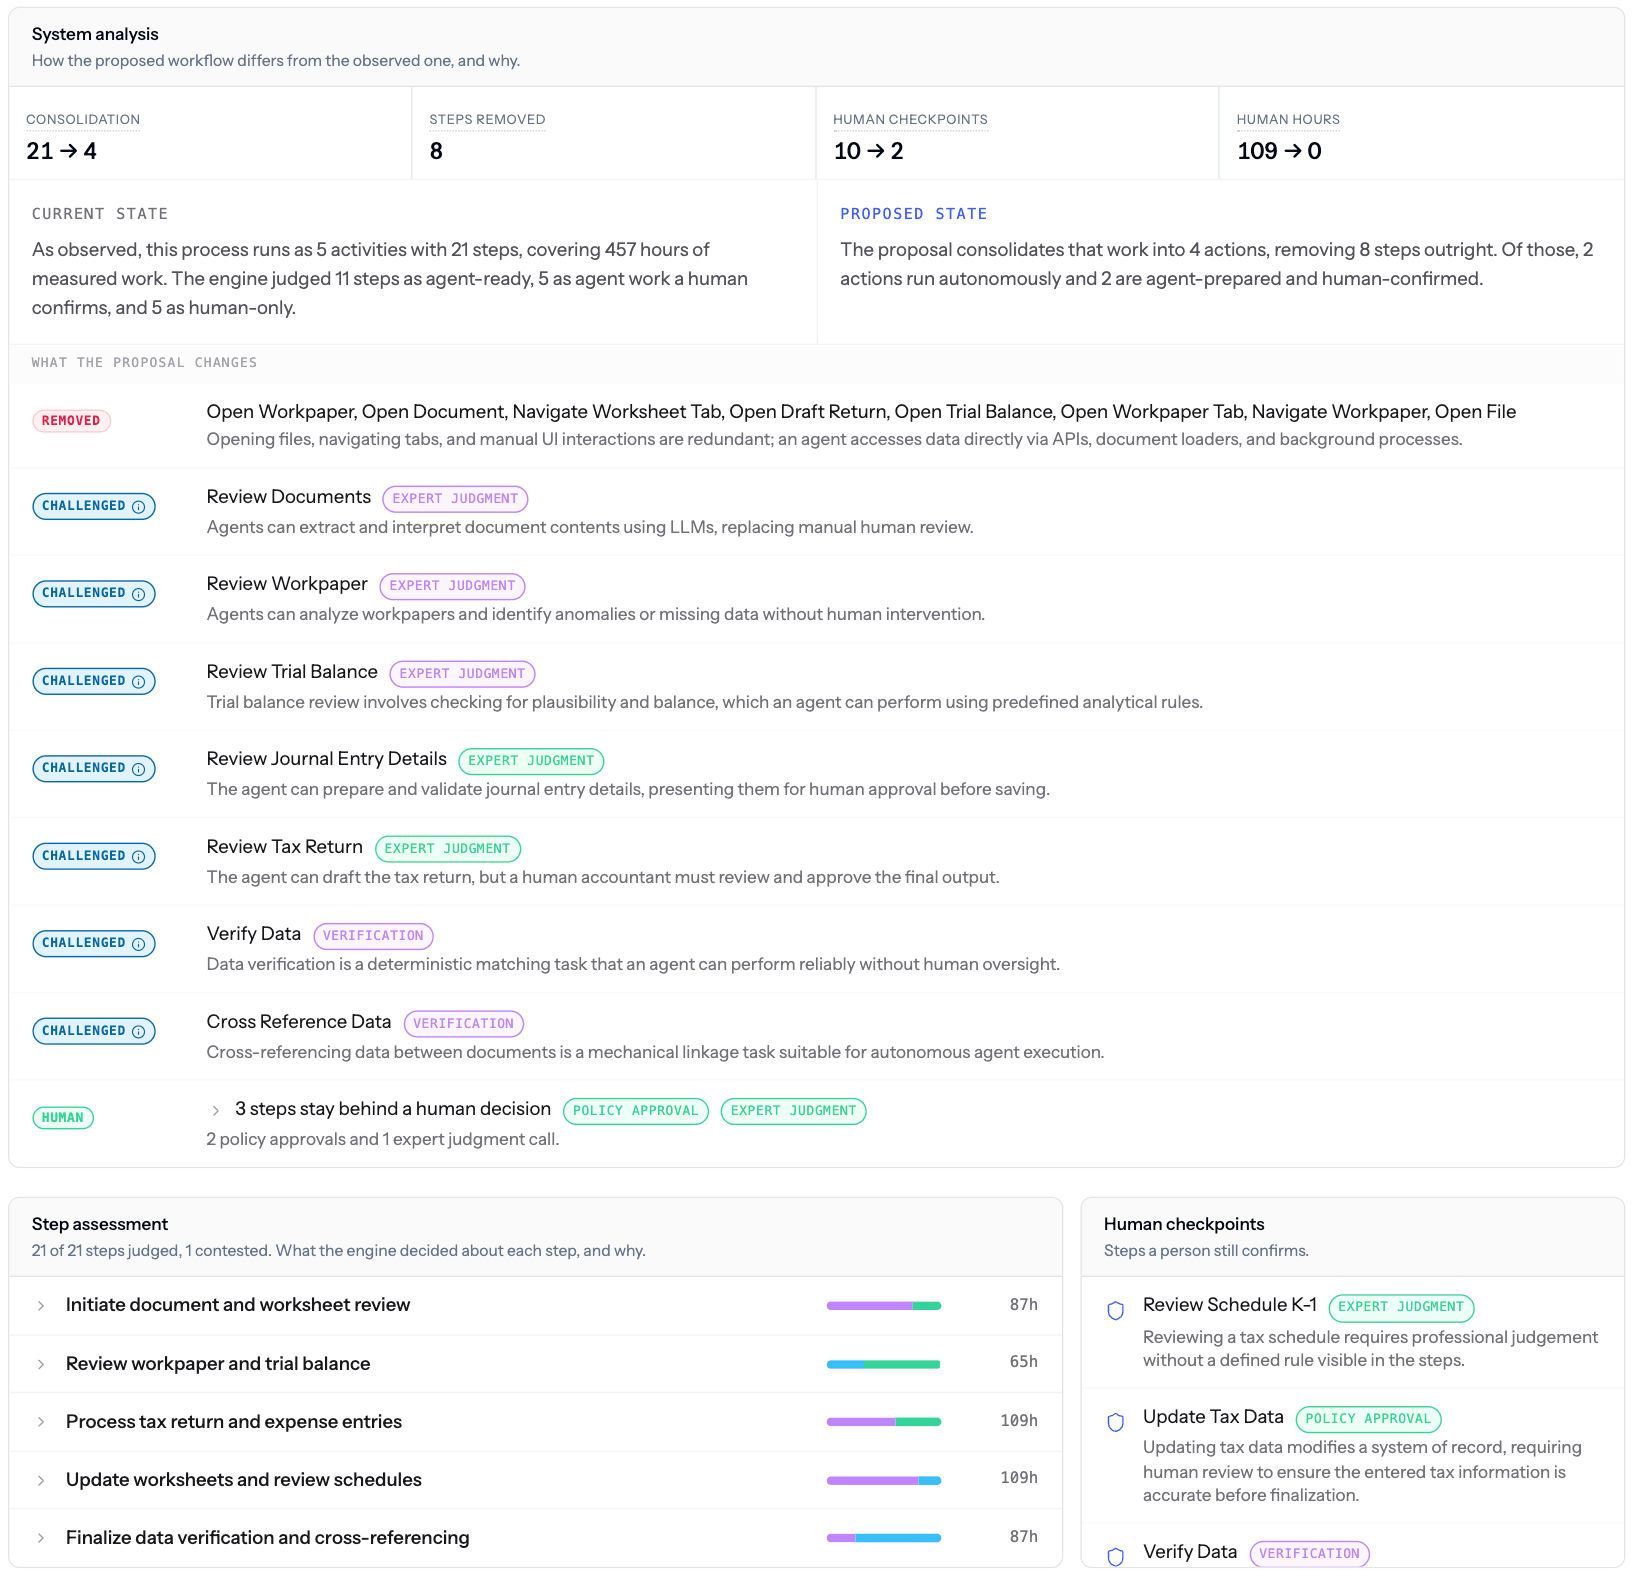 The **step assessment** panel shows how many steps have been judged and how many are contested.
**Human checkpoints** lists the conditions that still need a person, such as approval, policy, or verification. These are often the sensitive parts of a workflow, like anything involving monetary sums or complex decision making.
### Prioritization panel
The **step assessment** panel shows how many steps have been judged and how many are contested.
**Human checkpoints** lists the conditions that still need a person, such as approval, policy, or verification. These are often the sensitive parts of a workflow, like anything involving monetary sums or complex decision making.
### Prioritization panel
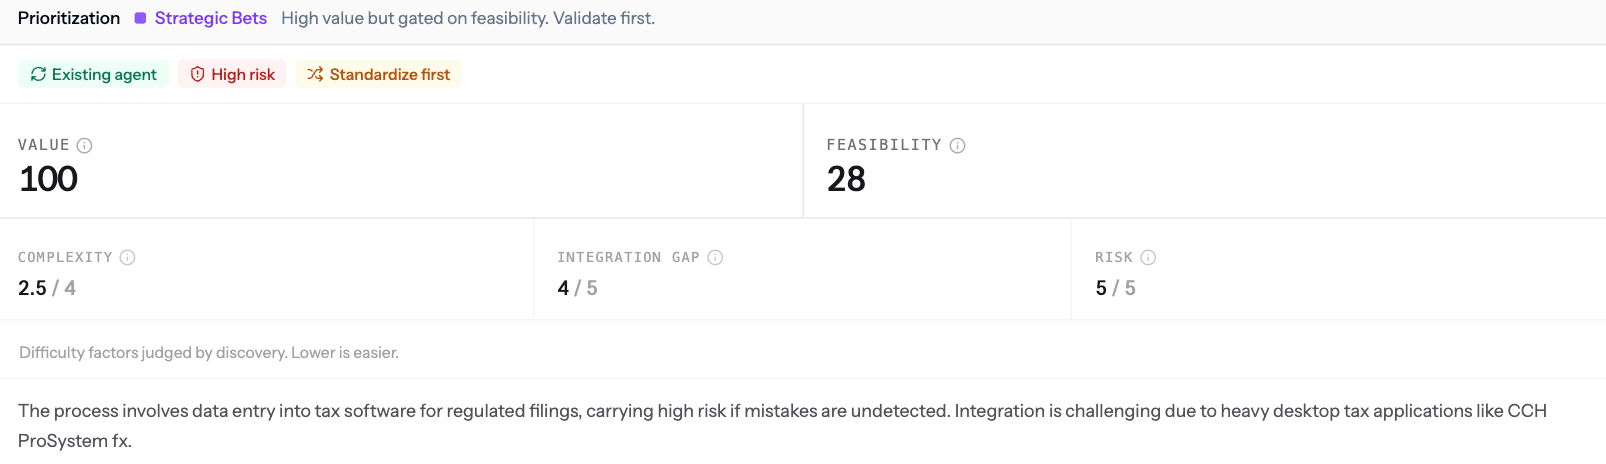 The **Prioritization** block flags if Fluency already has a similar AI automation pattern in production, and shows scores for **Value**, **Feasibility**, **Complexity**, **Integration gap**, and **Risk**, with a short rationale. The footer repeats the opportunity ID and last-analyzed date.
Need the full scoring model? Contact [support@usefluency.com](mailto:support@usefluency.com).
## Committing an AI automation opportunity
Committing an AI automation opportunity is how work moves into [Initiatives](/understanding-initiatives) for delivery.
## Why it matters
* One prioritized backlog of AI automation opportunities, grounded in real observed work instead of guesses or interviews.
* Every number ties back to steps and executions you can open and inspect.
* Value and feasibility are scored the same way for every AI automation opportunity, so leaders can compare apples to apples.
## Related
See how work actually runs, straight from what the Agent observes.
Track committed AI automation opportunities through delivery.
Set up the teams used for filtering across the product.
The loaded rates used to price time savings.
The **Prioritization** block flags if Fluency already has a similar AI automation pattern in production, and shows scores for **Value**, **Feasibility**, **Complexity**, **Integration gap**, and **Risk**, with a short rationale. The footer repeats the opportunity ID and last-analyzed date.
Need the full scoring model? Contact [support@usefluency.com](mailto:support@usefluency.com).
## Committing an AI automation opportunity
Committing an AI automation opportunity is how work moves into [Initiatives](/understanding-initiatives) for delivery.
## Why it matters
* One prioritized backlog of AI automation opportunities, grounded in real observed work instead of guesses or interviews.
* Every number ties back to steps and executions you can open and inspect.
* Value and feasibility are scored the same way for every AI automation opportunity, so leaders can compare apples to apples.
## Related
See how work actually runs, straight from what the Agent observes.
Track committed AI automation opportunities through delivery.
Set up the teams used for filtering across the product.
The loaded rates used to price time savings.