> ## Documentation Index
> Fetch the complete documentation index at: https://docs.usefluency.com/llms.txt
> Use this file to discover all available pages before exploring further.
# Work Explorer
> See how work actually runs in your organization, built automatically from what the Fluency Desktop Agent observes.
**Work Explorer** is your live map of how work actually gets done, built automatically from activity the Fluency Desktop Agent captures. No mapping workshops, no static diagrams. Every [opportunity](/understanding-opportunities) you'll see in Fluency traces back to something you can open here.
Open [app.usefluency.com](https://app.usefluency.com) → **Work Explorer**.
## How it gets built
You don't need to map anything up front. Fluency does it for you.
The Desktop Agent captures activity during the hours set in your [Agent Policy](/configuring-agent-settings).
Fluency groups that activity into processes, activities, steps, and the apps they run in.
A process appears once there's enough consistent evidence. Useful coverage typically kicks in after about a week and gets richer the longer observation continues.
You don't need to organize work into this structure yourself. Fluency does everything automatically.
## How work is organized
Fluency organizes everything into five levels. Each level rolls up into the one above it, so leaders and managers can view work at the vantage point that they desire.
| Level | What it is |
| ----------------- | ---------------------------------------------------------------------------------------------------- |
| **Category** | A standard bucket of work (for example, Finance or HR). Only categories with discovered work appear. |
| **Process group** | Related processes inside a category. |
| **Process** | A single end-to-end unit of work. |
| **Activity** | A key procedure inside a process. |
| **Step** | The smallest tracked action inside an activity. |
The hierarchy follows [APQC](https://www.simplifyingprocesses.com/blog/process-framework), an industry-standard way to classify business work.
## Browse categories and process groups
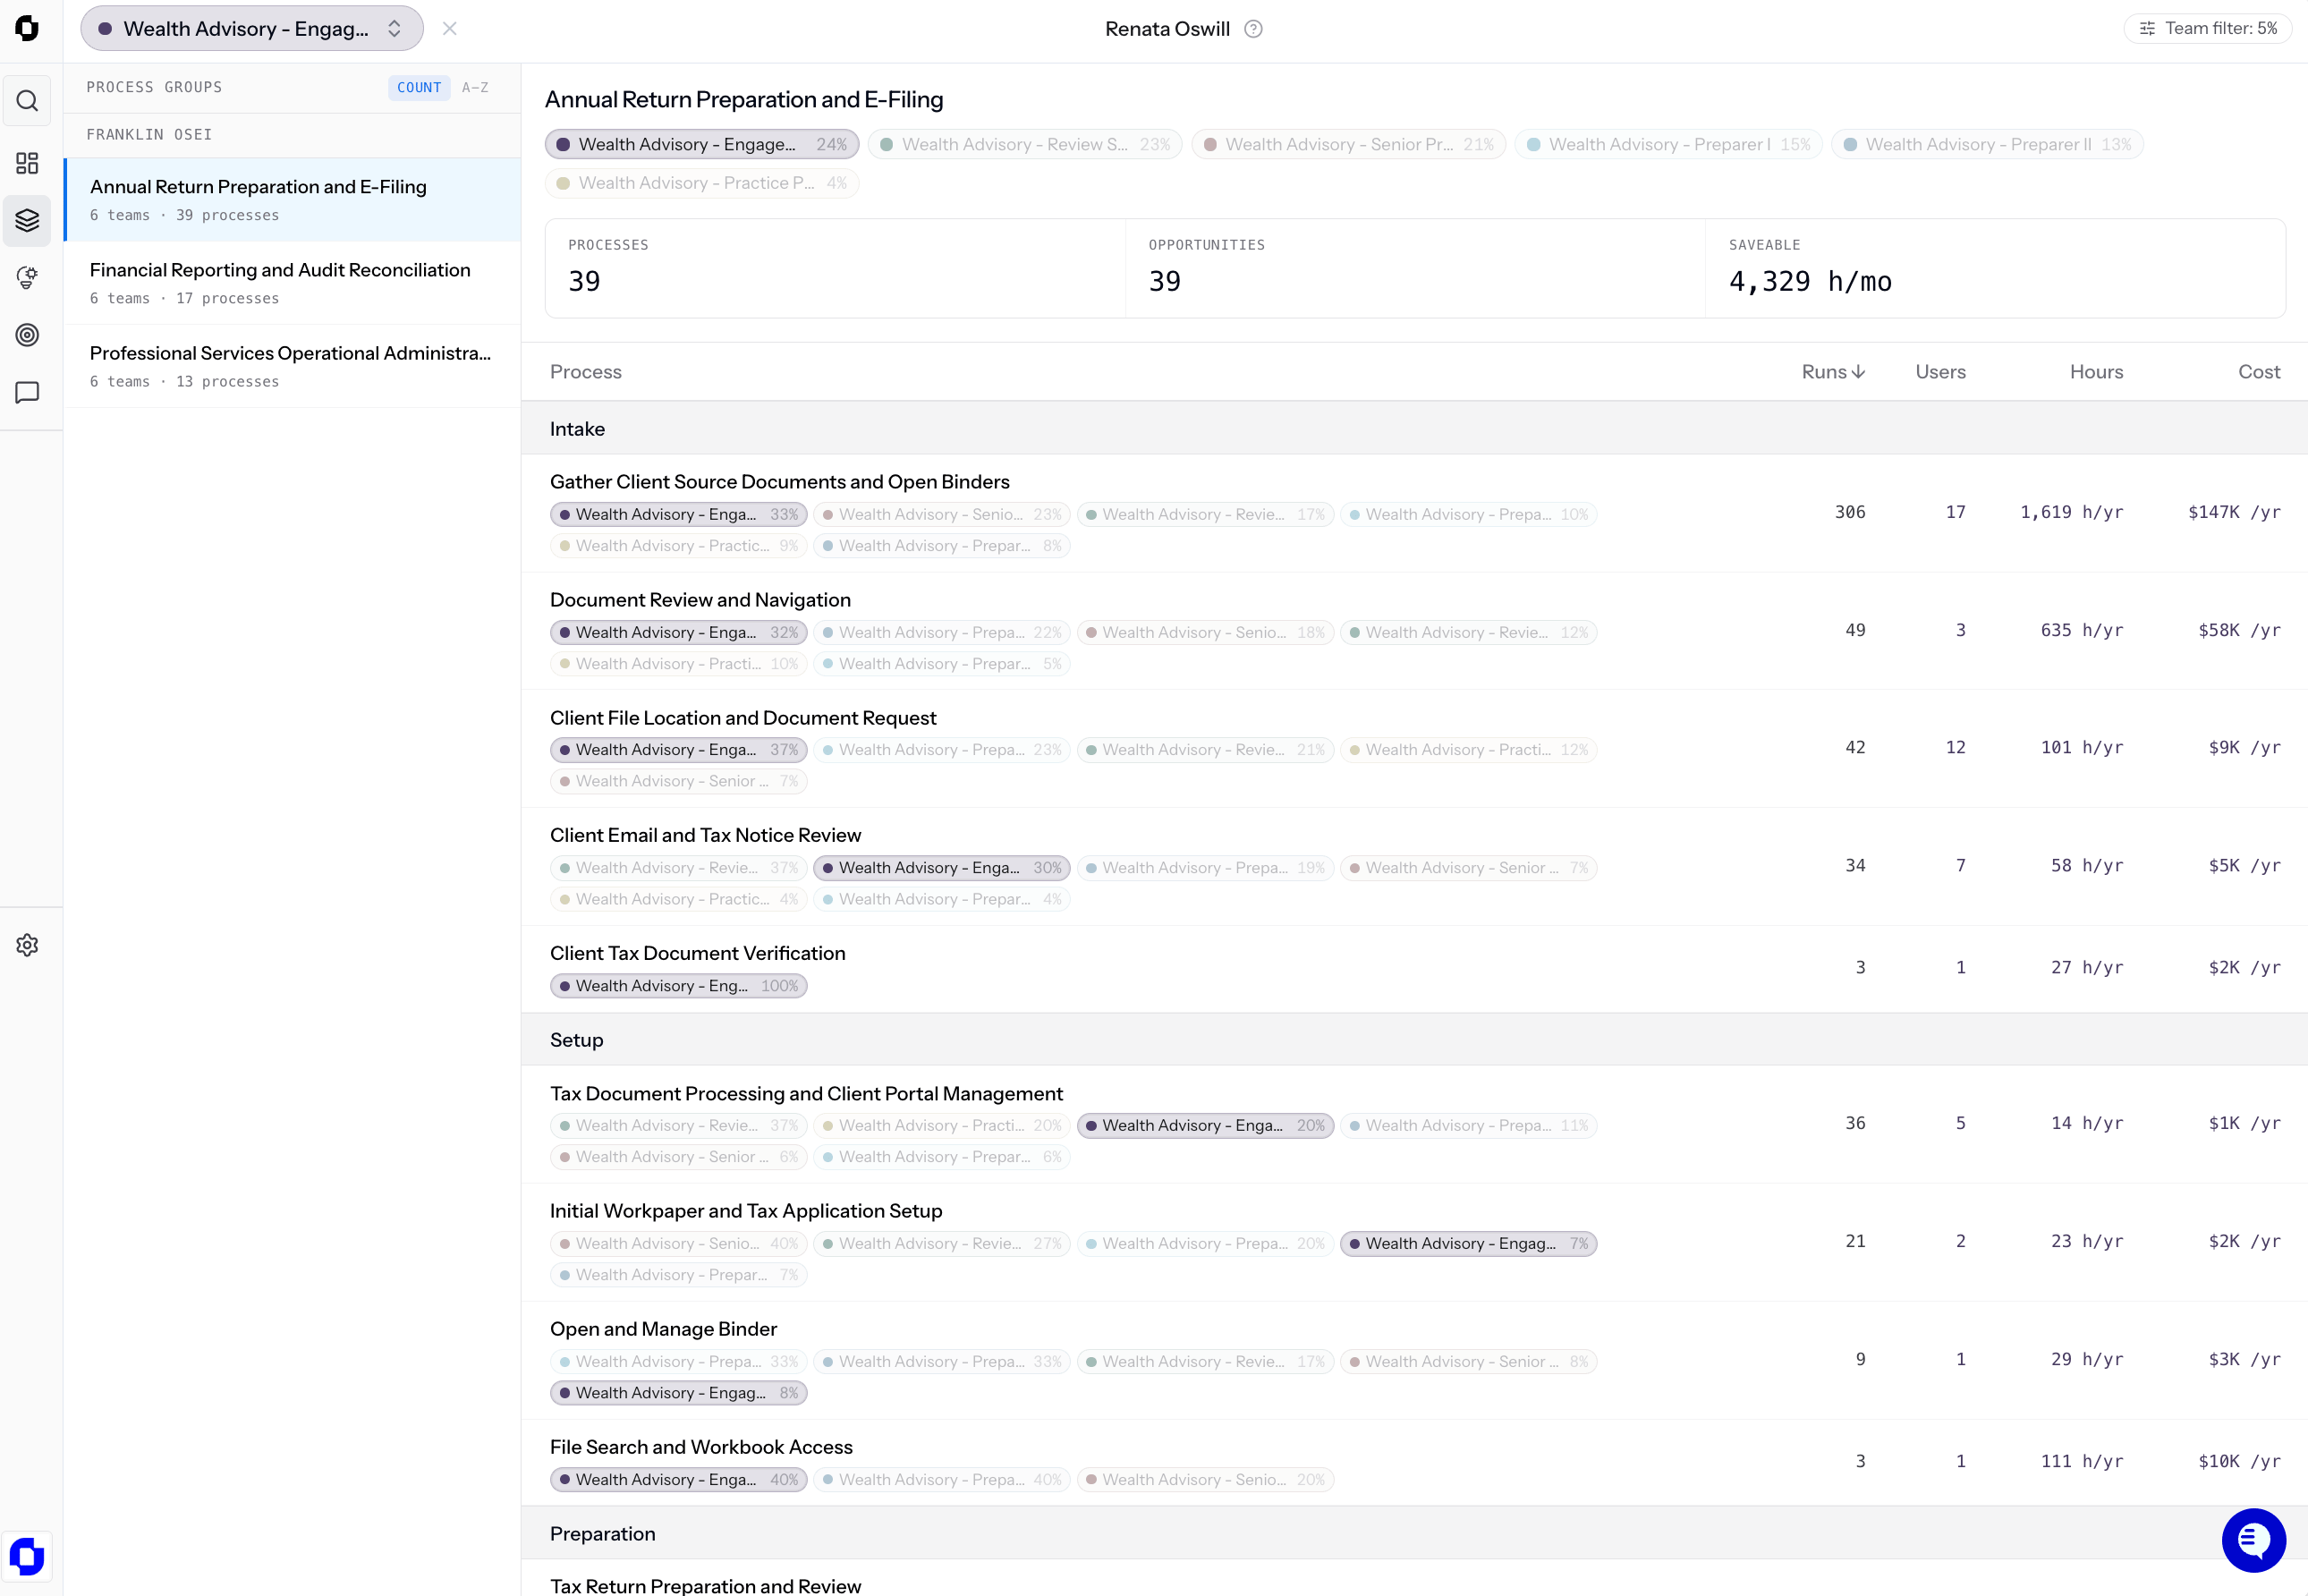
The Work Explorer landing page lists categories. Each row shows how many process groups sit underneath.
* Open a **category** to see its process groups.
* Open a **process group** to see individual processes.
* Open a **process** to see its diagram and activities.
## The process page
Open any process to see its activities, the apps they touch, and how they connect. The diagram has a layout toggle at the top:
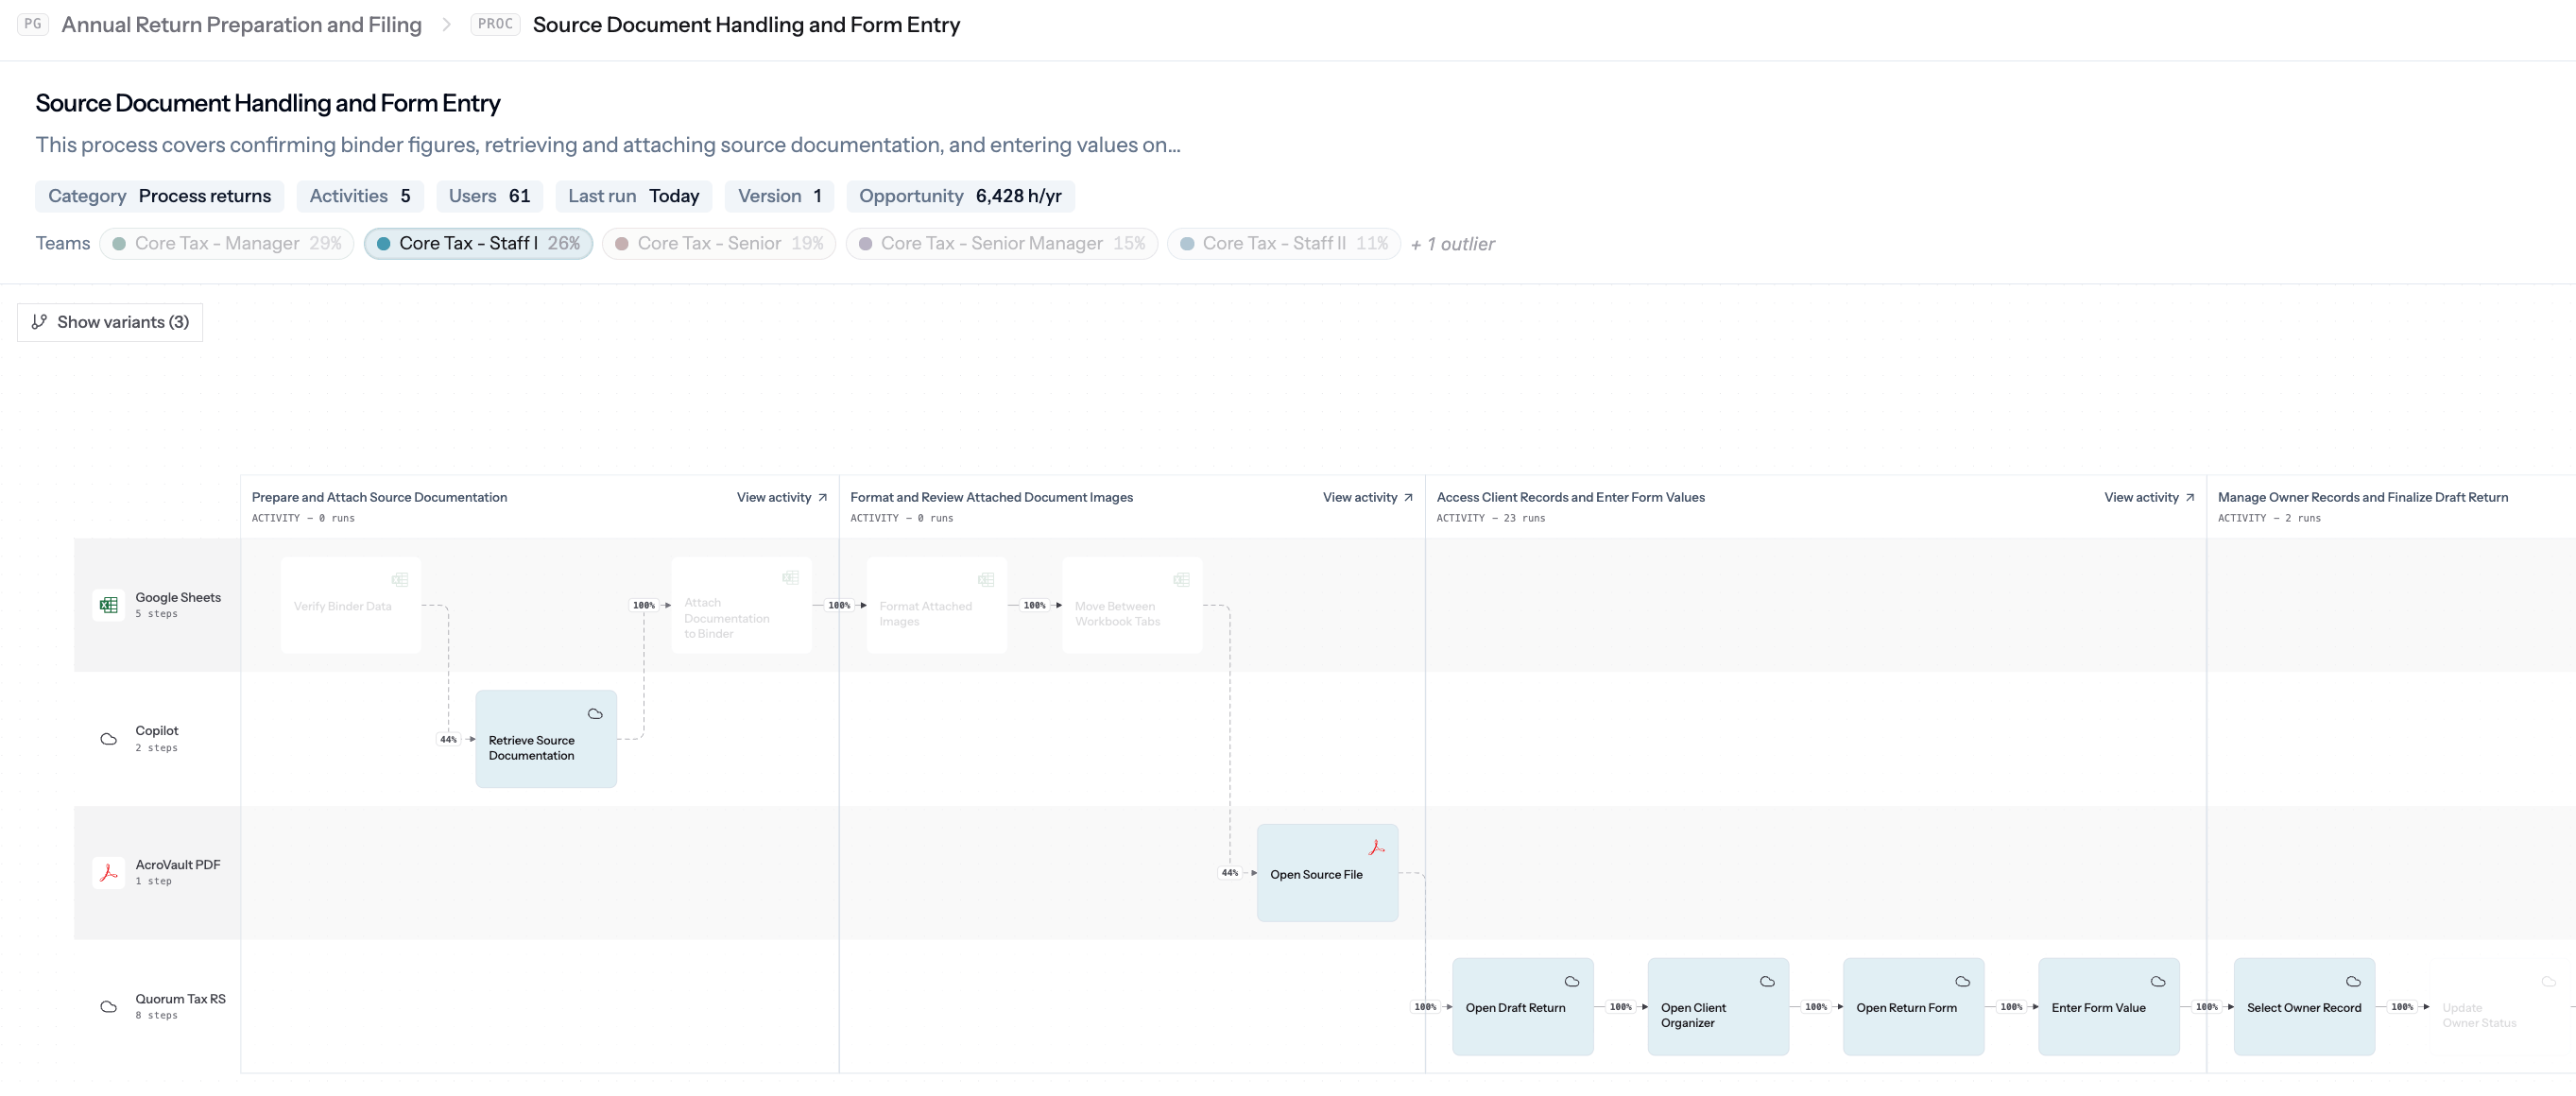
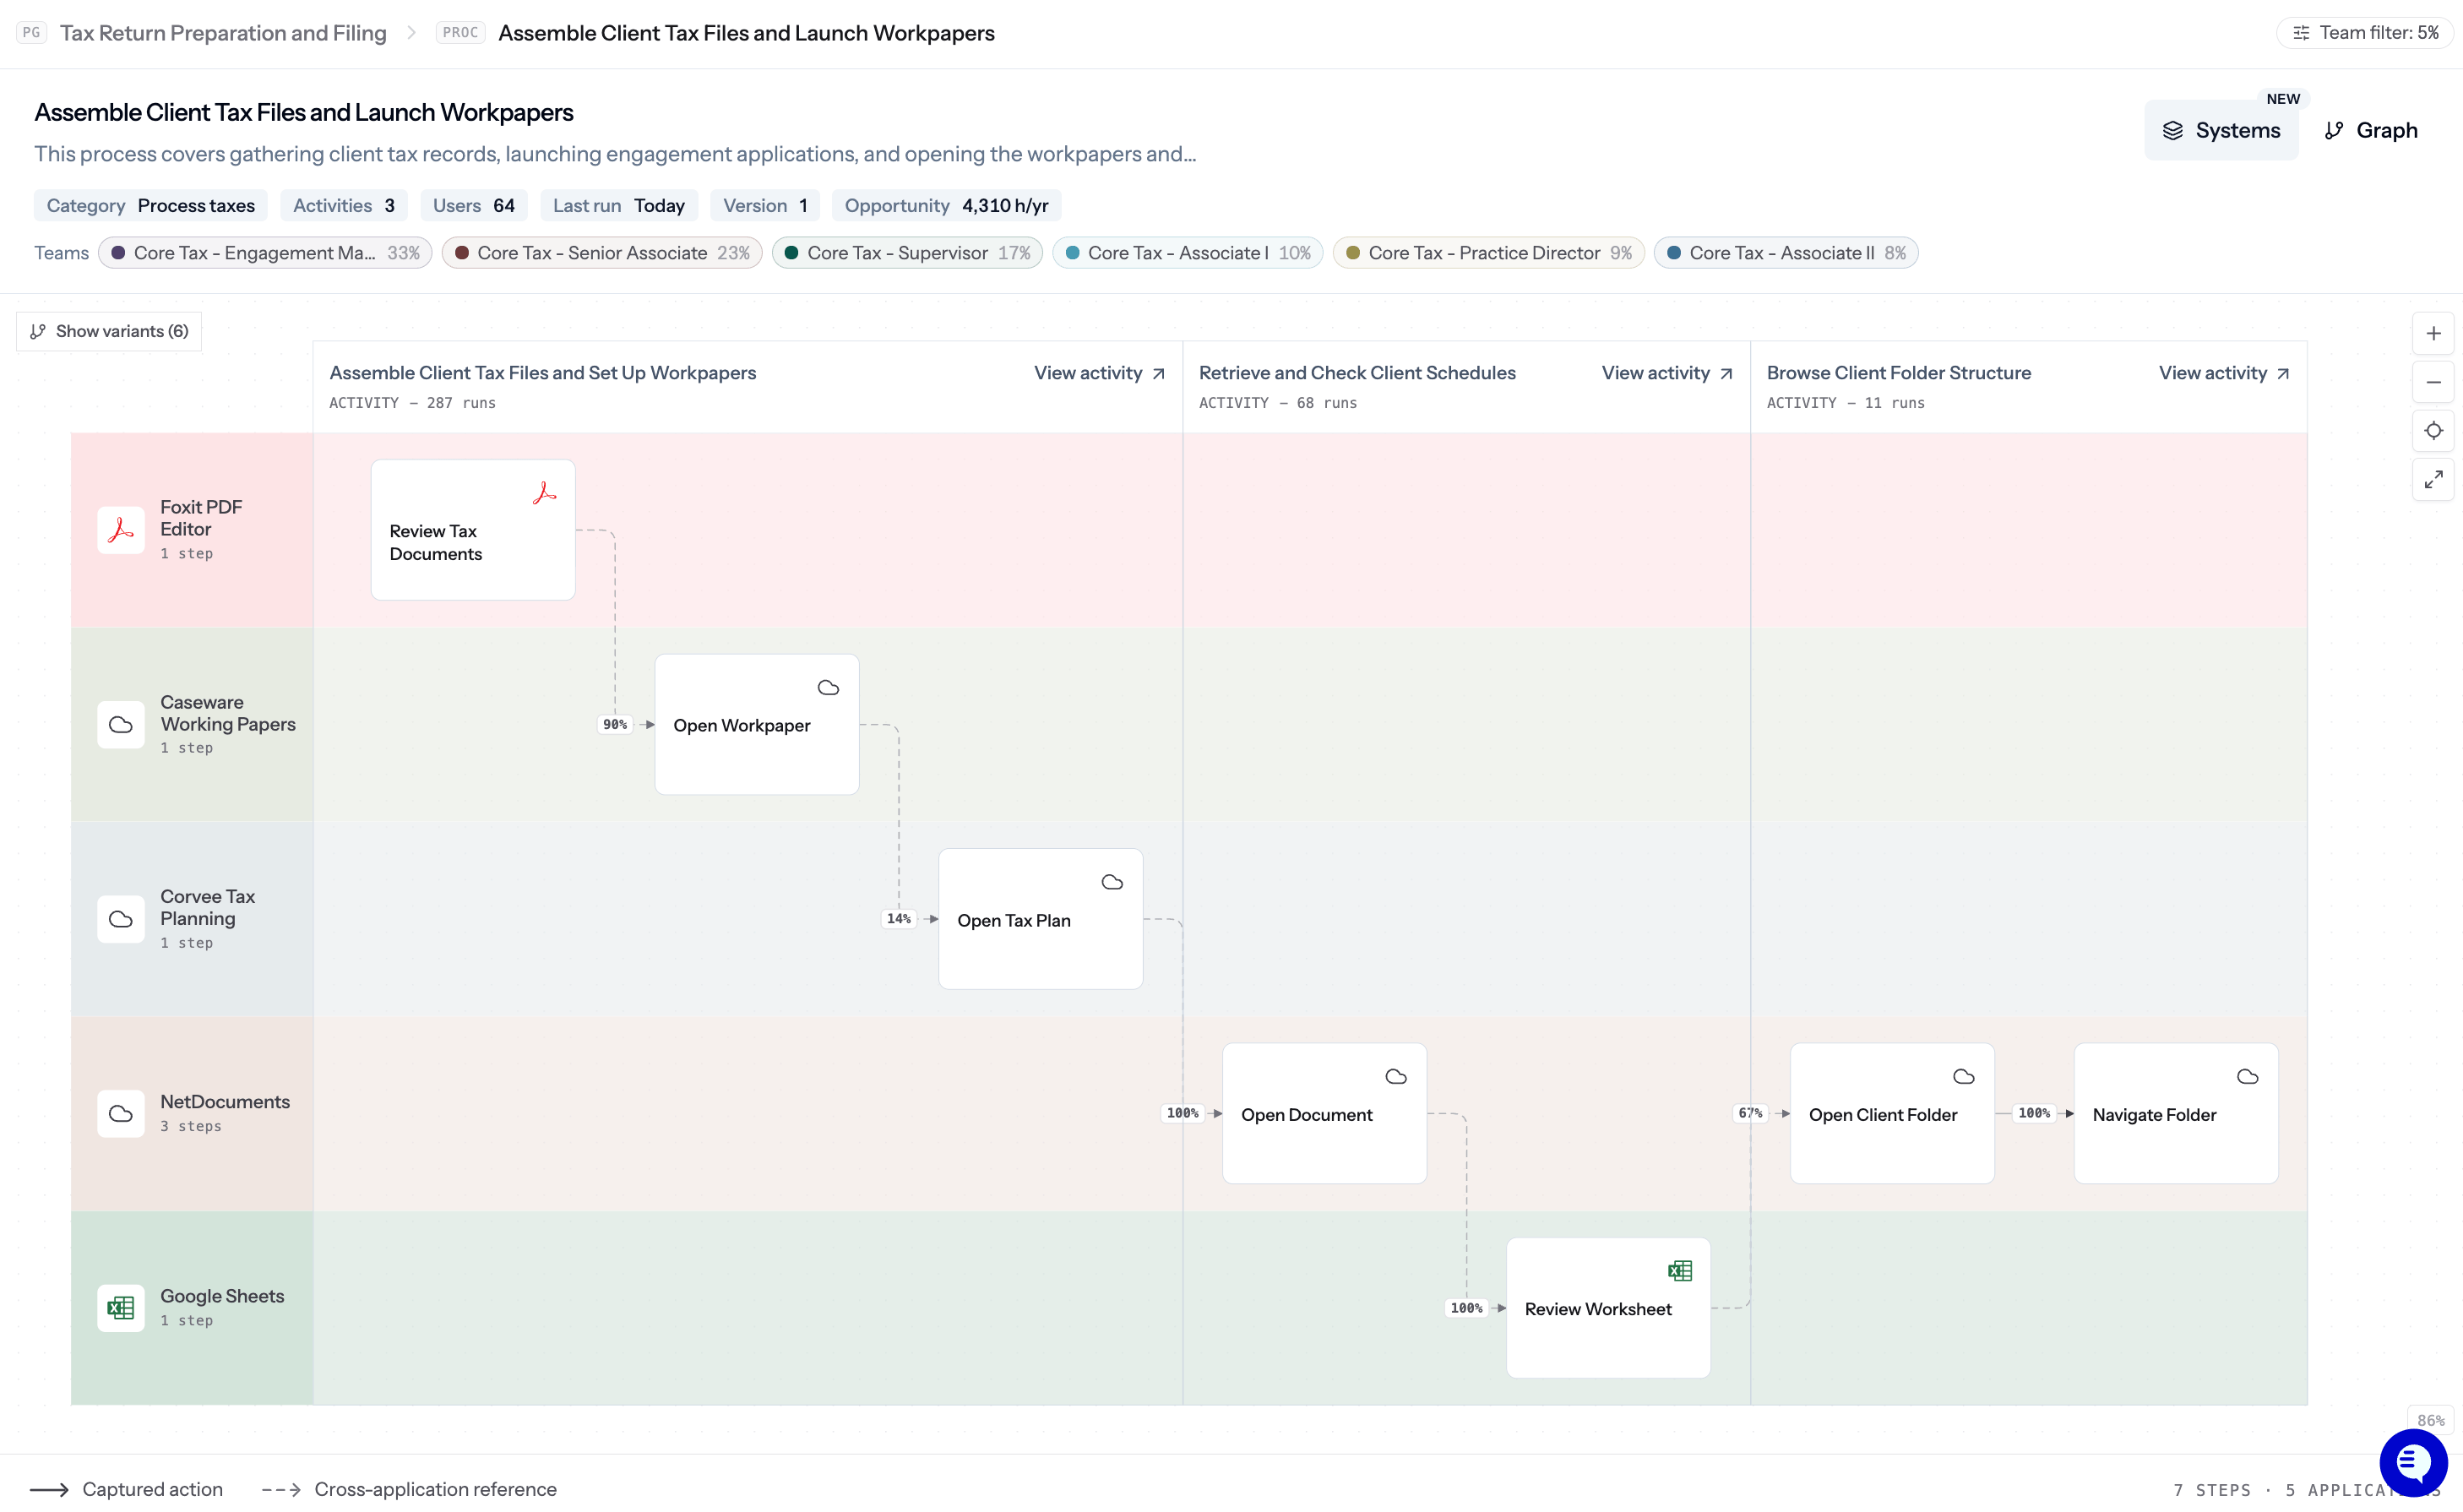 Each application that is part of a process gets its own swim-lane. Steps sit in the lane of the app they happen in, and anything that jumps between apps is drawn as a **cross-application reference**.
Use this when you want to see which systems are involved and where handoffs happen. By default, the process map is constrained to its key spine but you can select "show variants" to display every single path that has been completed within all executions so far.
Each application that is part of a process gets its own swim-lane. Steps sit in the lane of the app they happen in, and anything that jumps between apps is drawn as a **cross-application reference**.
Use this when you want to see which systems are involved and where handoffs happen. By default, the process map is constrained to its key spine but you can select "show variants" to display every single path that has been completed within all executions so far.
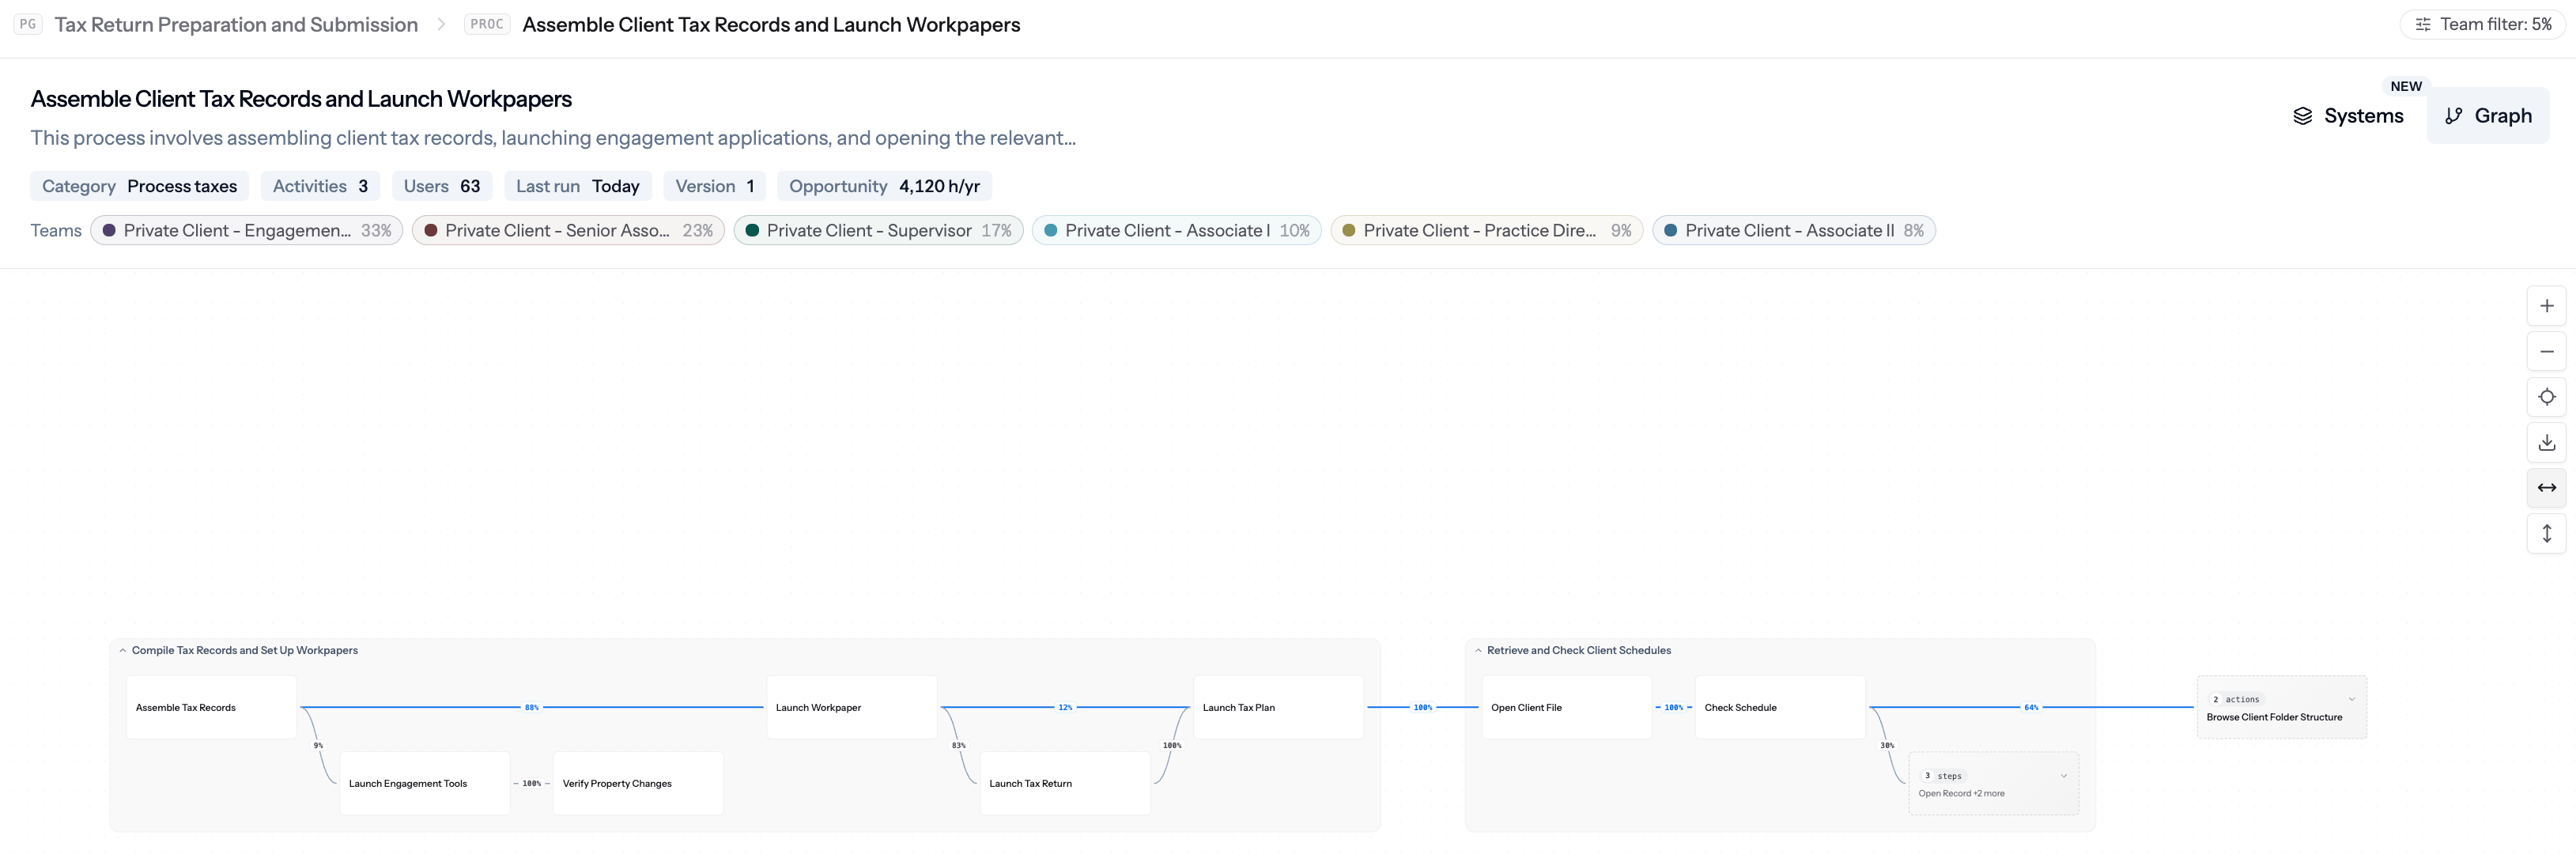 The same activities and steps without swim-lanes.
Use this when you care about sequence more than which app owns each step.
The same activities and steps without swim-lanes.
Use this when you care about sequence more than which app owns each step.
The graph view also shows every single variant and throughput of the process.
### Diagram controls
| Control | What it does |
| ----------------- | ---------------------------------------------------------------------------------- |
| **Show variants** | Overlays alternate paths on the diagram. The button shows how many variants exist. |
| **Zoom in / out** | Scales the diagram. |
| **Fit to view** | Resets zoom so the whole diagram fits on screen. |
| **Full screen** | Expands the canvas for easier reading. |
## Variants
When Fluency sees the **same process or outcome completed** but in genuinely different way (extra approvals, different tools, exceptions or edge cases), it records that route as a **variant**. Variants aren't a sixth level. On any process page, click **Show variants** to see the alternate paths on the diagram (they will populate and expand the diagram).
## The activity page
Open any activity for the full step-by-step map of the procedure: each step in order, the app it uses, and how long it takes. This can be done by clicking onto a node from the process map (either via systems view or graph view).
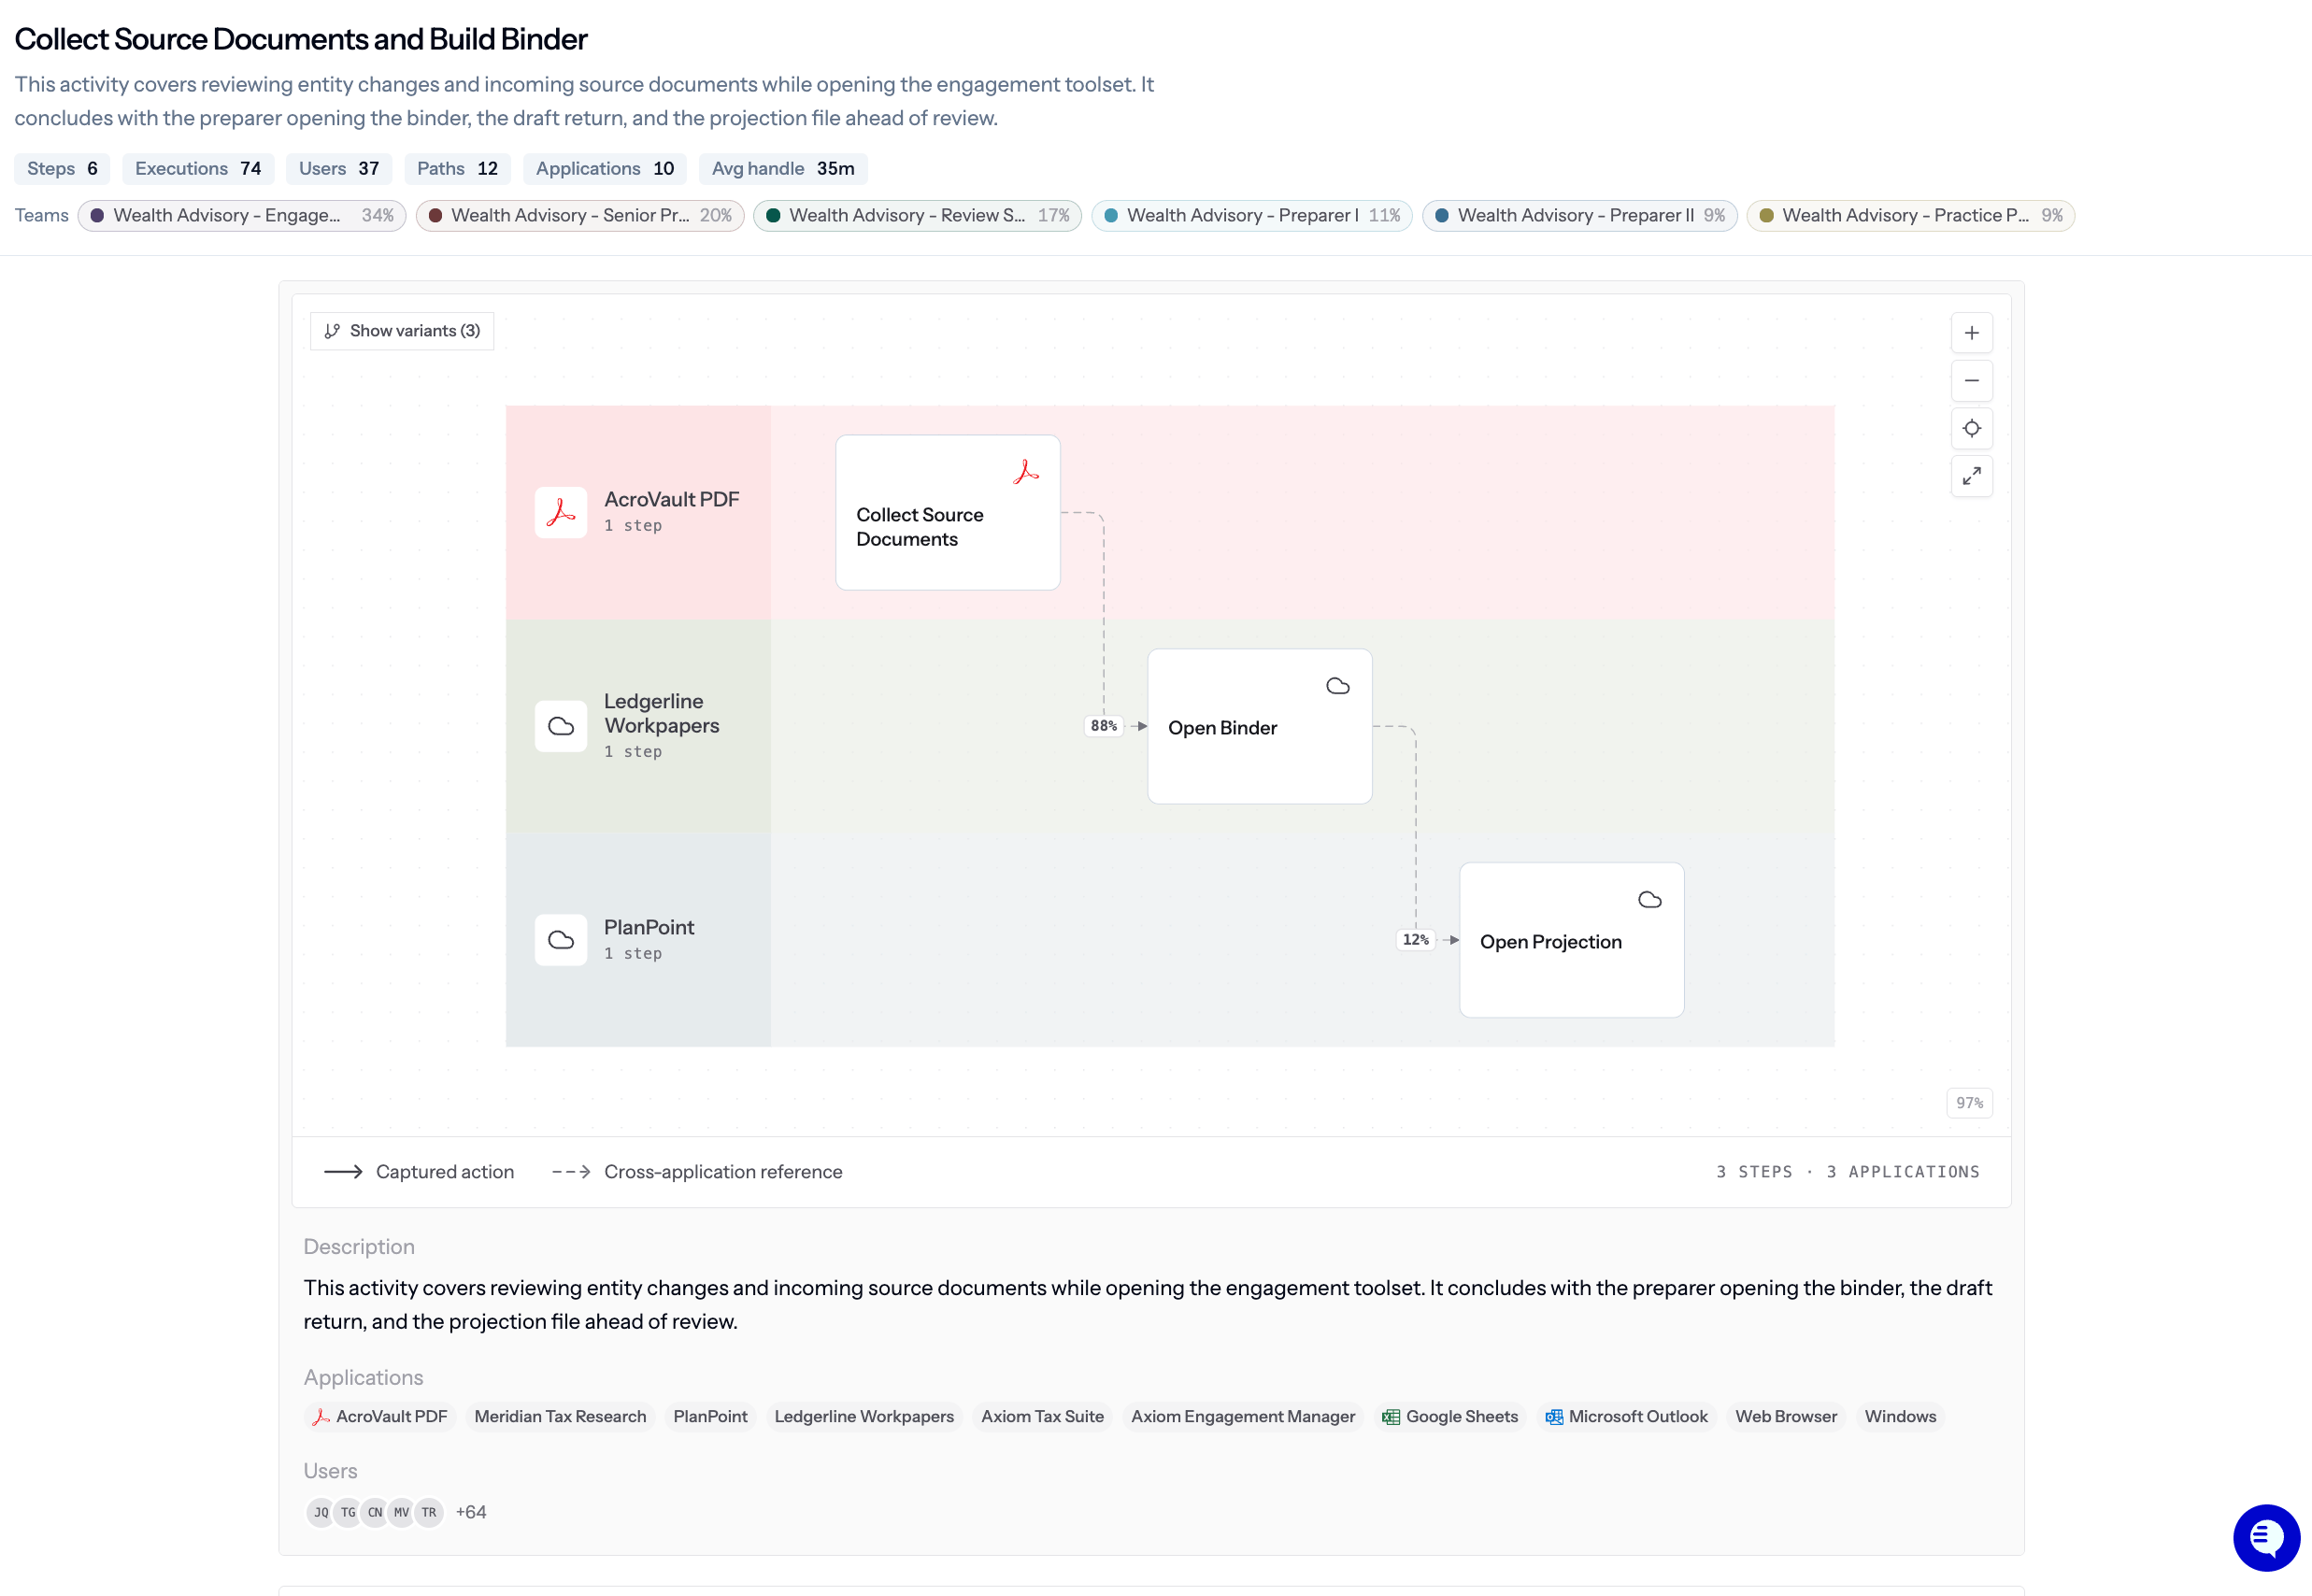 Below the activity map and steps you'll see:
* **Executions** - a paged table of every run, with who ran it, when it started, handle time, and elapsed time.
Below the activity map and steps you'll see:
* **Executions** - a paged table of every run, with who ran it, when it started, handle time, and elapsed time.
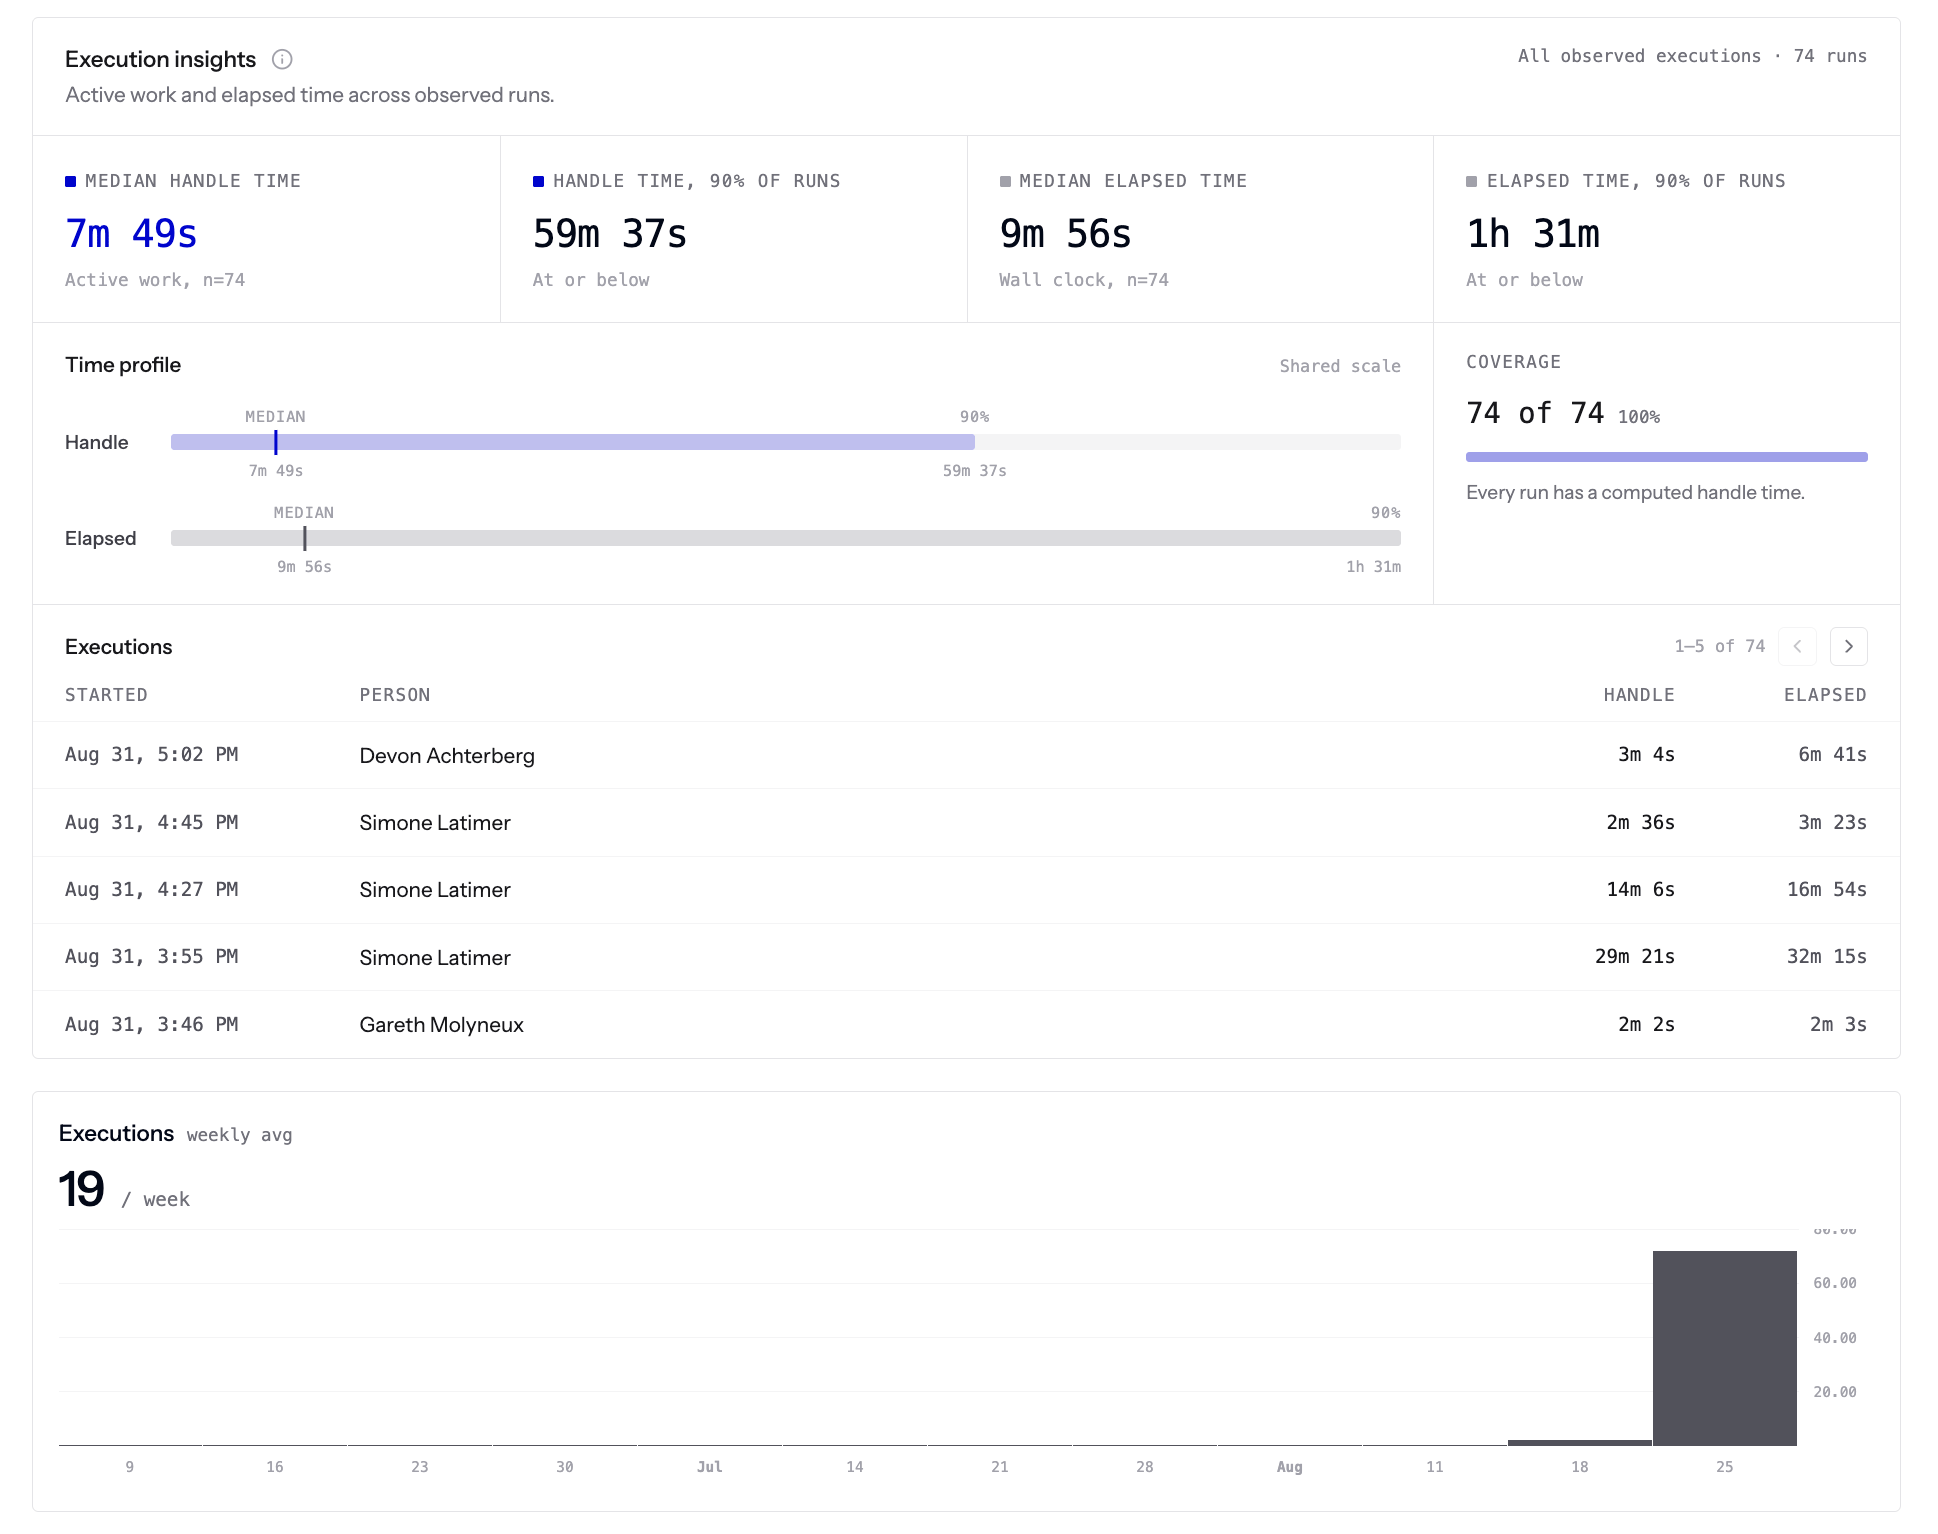 **Handle time** is the time actively spent on the step. **Elapsed time** is the total time from start to finish, including any waiting or interruptions.
## Filter by team
Every level in Work Explorer (process group, process, activity) lets you filter by team. Most work is end-to-end and touches more than one team, so this is how you zoom in on the part your team actually owns, and see exactly how much of a process runs through them.
Teams come from [Settings → Teams](/setting-up-teams).
At the top of any process group, process, or activity page, open the **Teams** filter.
Hover a team to include it. You can select as many as you want.
The diagram updates to show which parts of the work those teams touch, and what share of each activity they're responsible for.
**Handle time** is the time actively spent on the step. **Elapsed time** is the total time from start to finish, including any waiting or interruptions.
## Filter by team
Every level in Work Explorer (process group, process, activity) lets you filter by team. Most work is end-to-end and touches more than one team, so this is how you zoom in on the part your team actually owns, and see exactly how much of a process runs through them.
Teams come from [Settings → Teams](/setting-up-teams).
At the top of any process group, process, or activity page, open the **Teams** filter.
Hover a team to include it. You can select as many as you want.
The diagram updates to show which parts of the work those teams touch, and what share of each activity they're responsible for.
 ### Involvement threshold
Fluency decides whether a team is "involved" in a step by measuring how much of that step's activity belongs to them.
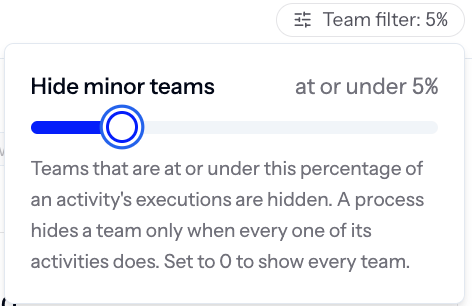
* The default threshold is **5%**. If a team accounts for more than 5% of a step, they show up on it.
* Adjust the slider in the top right to raise or lower the threshold. Lower it (for example, 0%) to see every team that touches the work, or raise it (for example, 10%) to focus on the teams doing most of it.
### Involvement threshold
Fluency decides whether a team is "involved" in a step by measuring how much of that step's activity belongs to them.
* The default threshold is **5%**. If a team accounts for more than 5% of a step, they show up on it.
* Adjust the slider in the top right to raise or lower the threshold. Lower it (for example, 0%) to see every team that touches the work, or raise it (for example, 10%) to focus on the teams doing most of it.
 The same team filter and threshold slider apply on the [Opportunities](/understanding-opportunities) page, so filtering behaves consistently across the product.
## Why it matters
* One source of truth for how work actually runs, based on real observation instead of a static process doc.
* The starting point for automation: every opportunity in Fluency points to real steps and handoffs within a key process that you can open and inspect here.
## Related
Turn observed work into automation candidates.
Group opportunities into projects you can track.
Control when and where the Agent observes.
Set up the teams used for filtering across the product.
The same team filter and threshold slider apply on the [Opportunities](/understanding-opportunities) page, so filtering behaves consistently across the product.
## Why it matters
* One source of truth for how work actually runs, based on real observation instead of a static process doc.
* The starting point for automation: every opportunity in Fluency points to real steps and handoffs within a key process that you can open and inspect here.
## Related
Turn observed work into automation candidates.
Group opportunities into projects you can track.
Control when and where the Agent observes.
Set up the teams used for filtering across the product.