.svg?fit=max&auto=format&n=9mgYzkCsWGfCgDGh&q=85&s=4fd670d691aa6a1a77dbfa0ed4830fb1)

What you’ll see
Every team page has two sections: Processes and Opportunities, each with a set of headline figures at the top.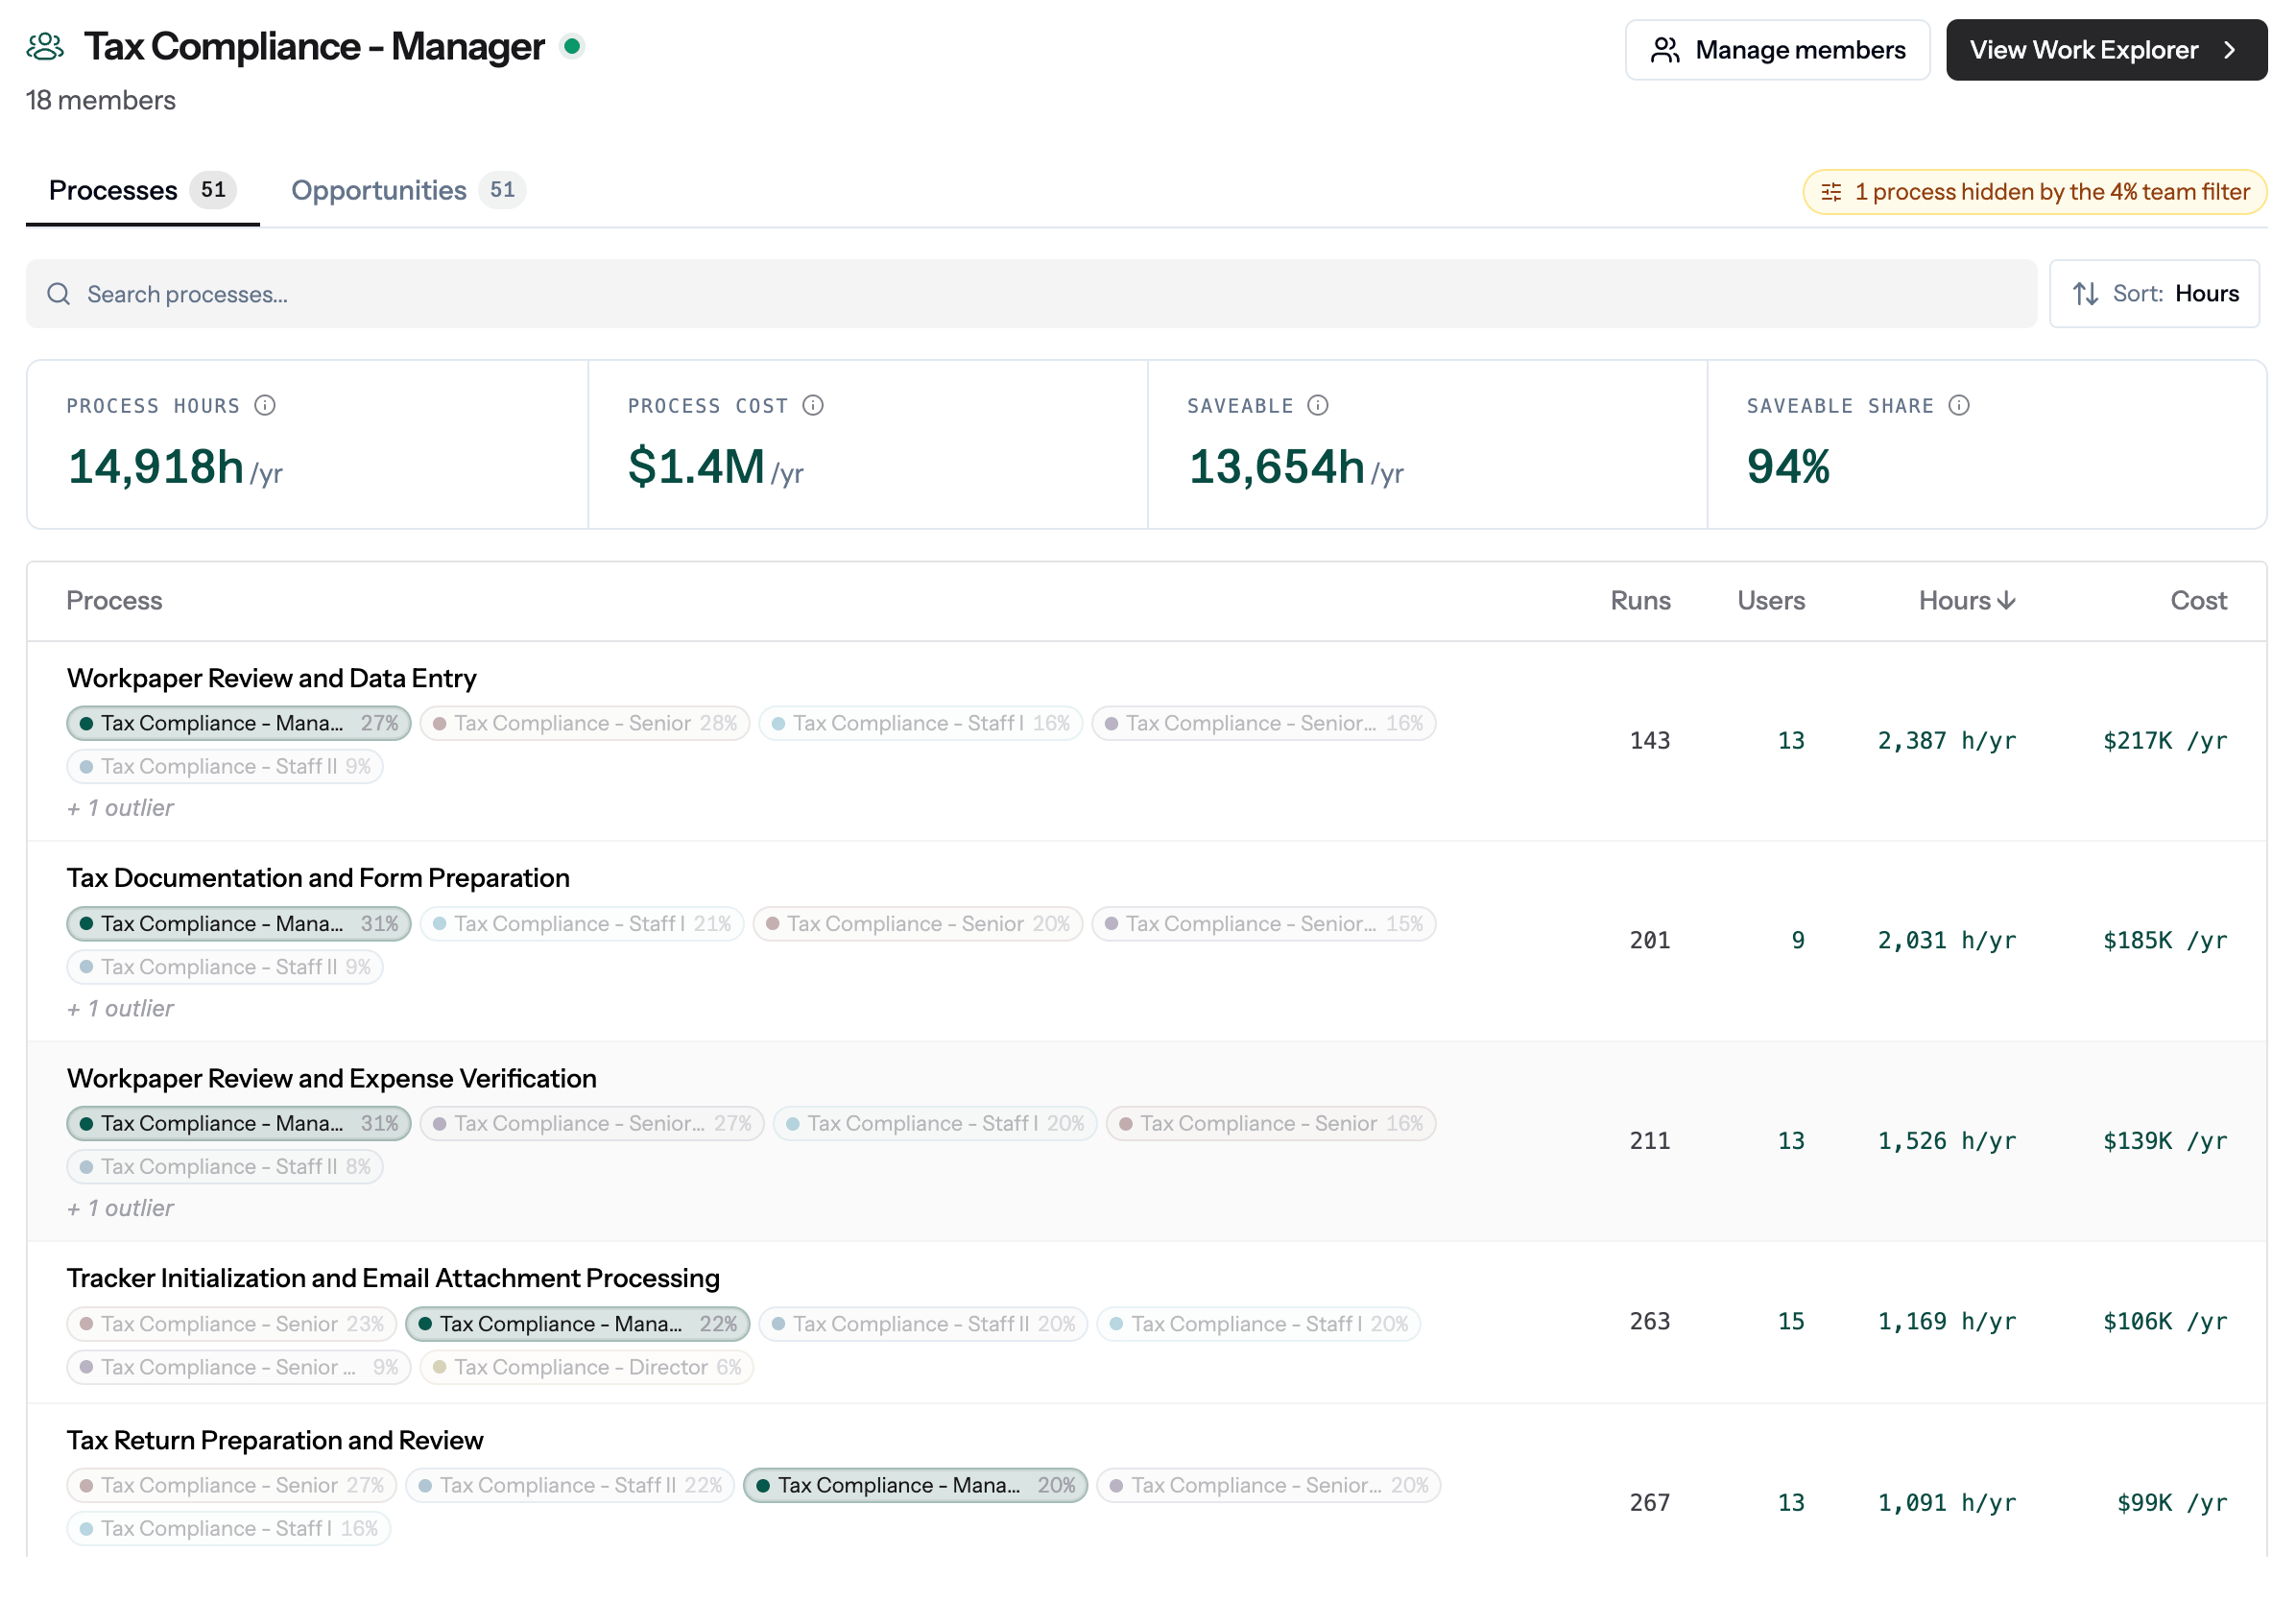
A team page showing the Processes tab, headline metrics, and the team's share of work across each process.
Processes
Every process this team is involved in, with roll-ups showing where their time and cost sits.Opportunities
Every AI automation opportunity the team touches, rolled up the same way.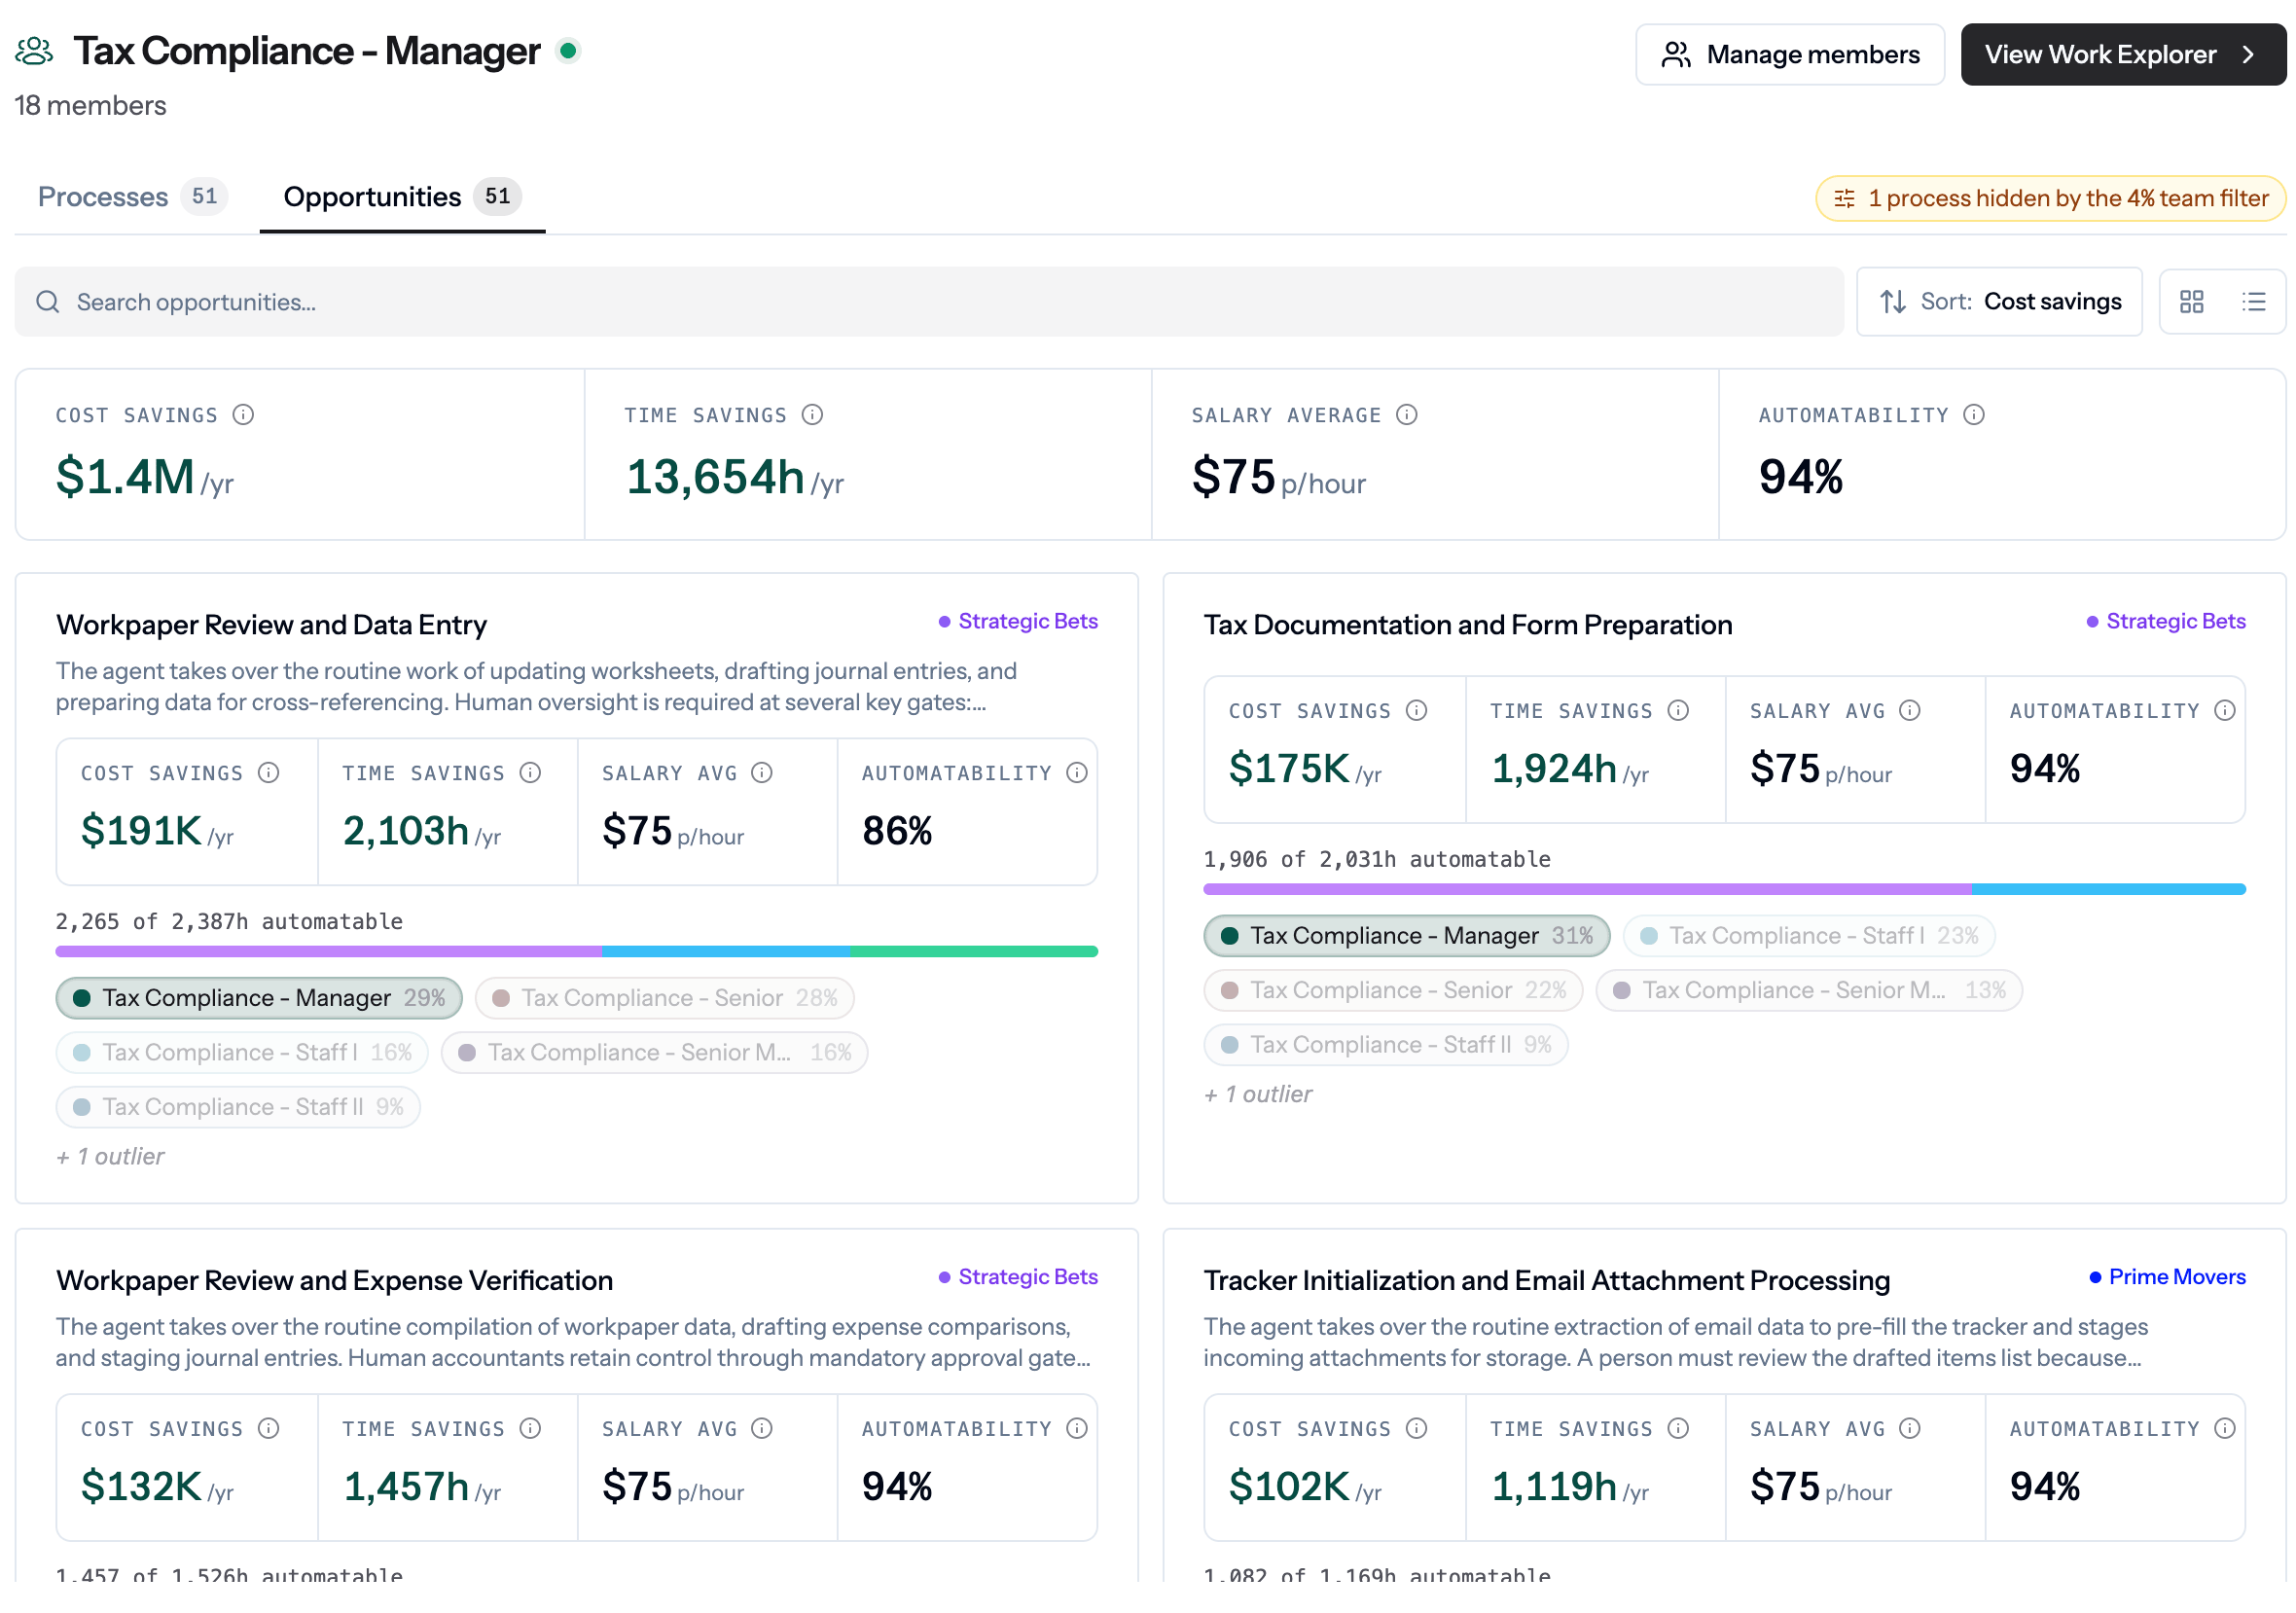
A team page showing the Opportunities tab with cost savings, time savings, salary average, and automatability rolled up across the team's AI automation opportunities.
Drilling in
Click any process or AI automation opportunity to open the full detail page, scoped to this team’s involvement.- Open a process to see the diagram, activities, and executions from Work Explorer, filtered to this team’s share of the work.
- Open an AI automation opportunity to see the full analysis from Opportunities, with the team’s percentages carried through.
Team Pages use the same involvement threshold as the team filter in Work Explorer and Opportunities. Adjust it there to change what shows up here.
Why it matters
- One page per team, so leaders and managers can see their team’s work without setting up filters.
- The same numbers as Work Explorer and Opportunities, just pre-filtered.
- Every metric ties back to a real process or AI automation opportunity you can open and inspect.
Related
Teams
Create teams and manage who’s in them.
Work Explorer
The full map of how work runs across the organization.
Opportunities
The full backlog of AI automation opportunities.
Rates
Set loaded rates so team hours and savings are priced correctly.